Private Mobility & Chauffeur Booking Platform
Zentroride
ZentroRide is a private mobility platform for fixed-price transfers, airport pickups, chauffeur hire, city tours, and fleet operations across the UAE and UK.
Role
Product Designer
Scope
Website, booking flow, rider dashboard, driver dashboard, partner dashboard, admin dashboard, product architecture, user flows, design system, QA.
Focus
Product UX · Information architecture · Service design · Operations dashboards · Booking flows · Design systems · Responsive web · Design QA.
Research Inputs
Desk research, competitor teardown, 14 user interviews, stakeholder interviews, 9 usability test sessions, and a survey with 78 valid responses.
The Product
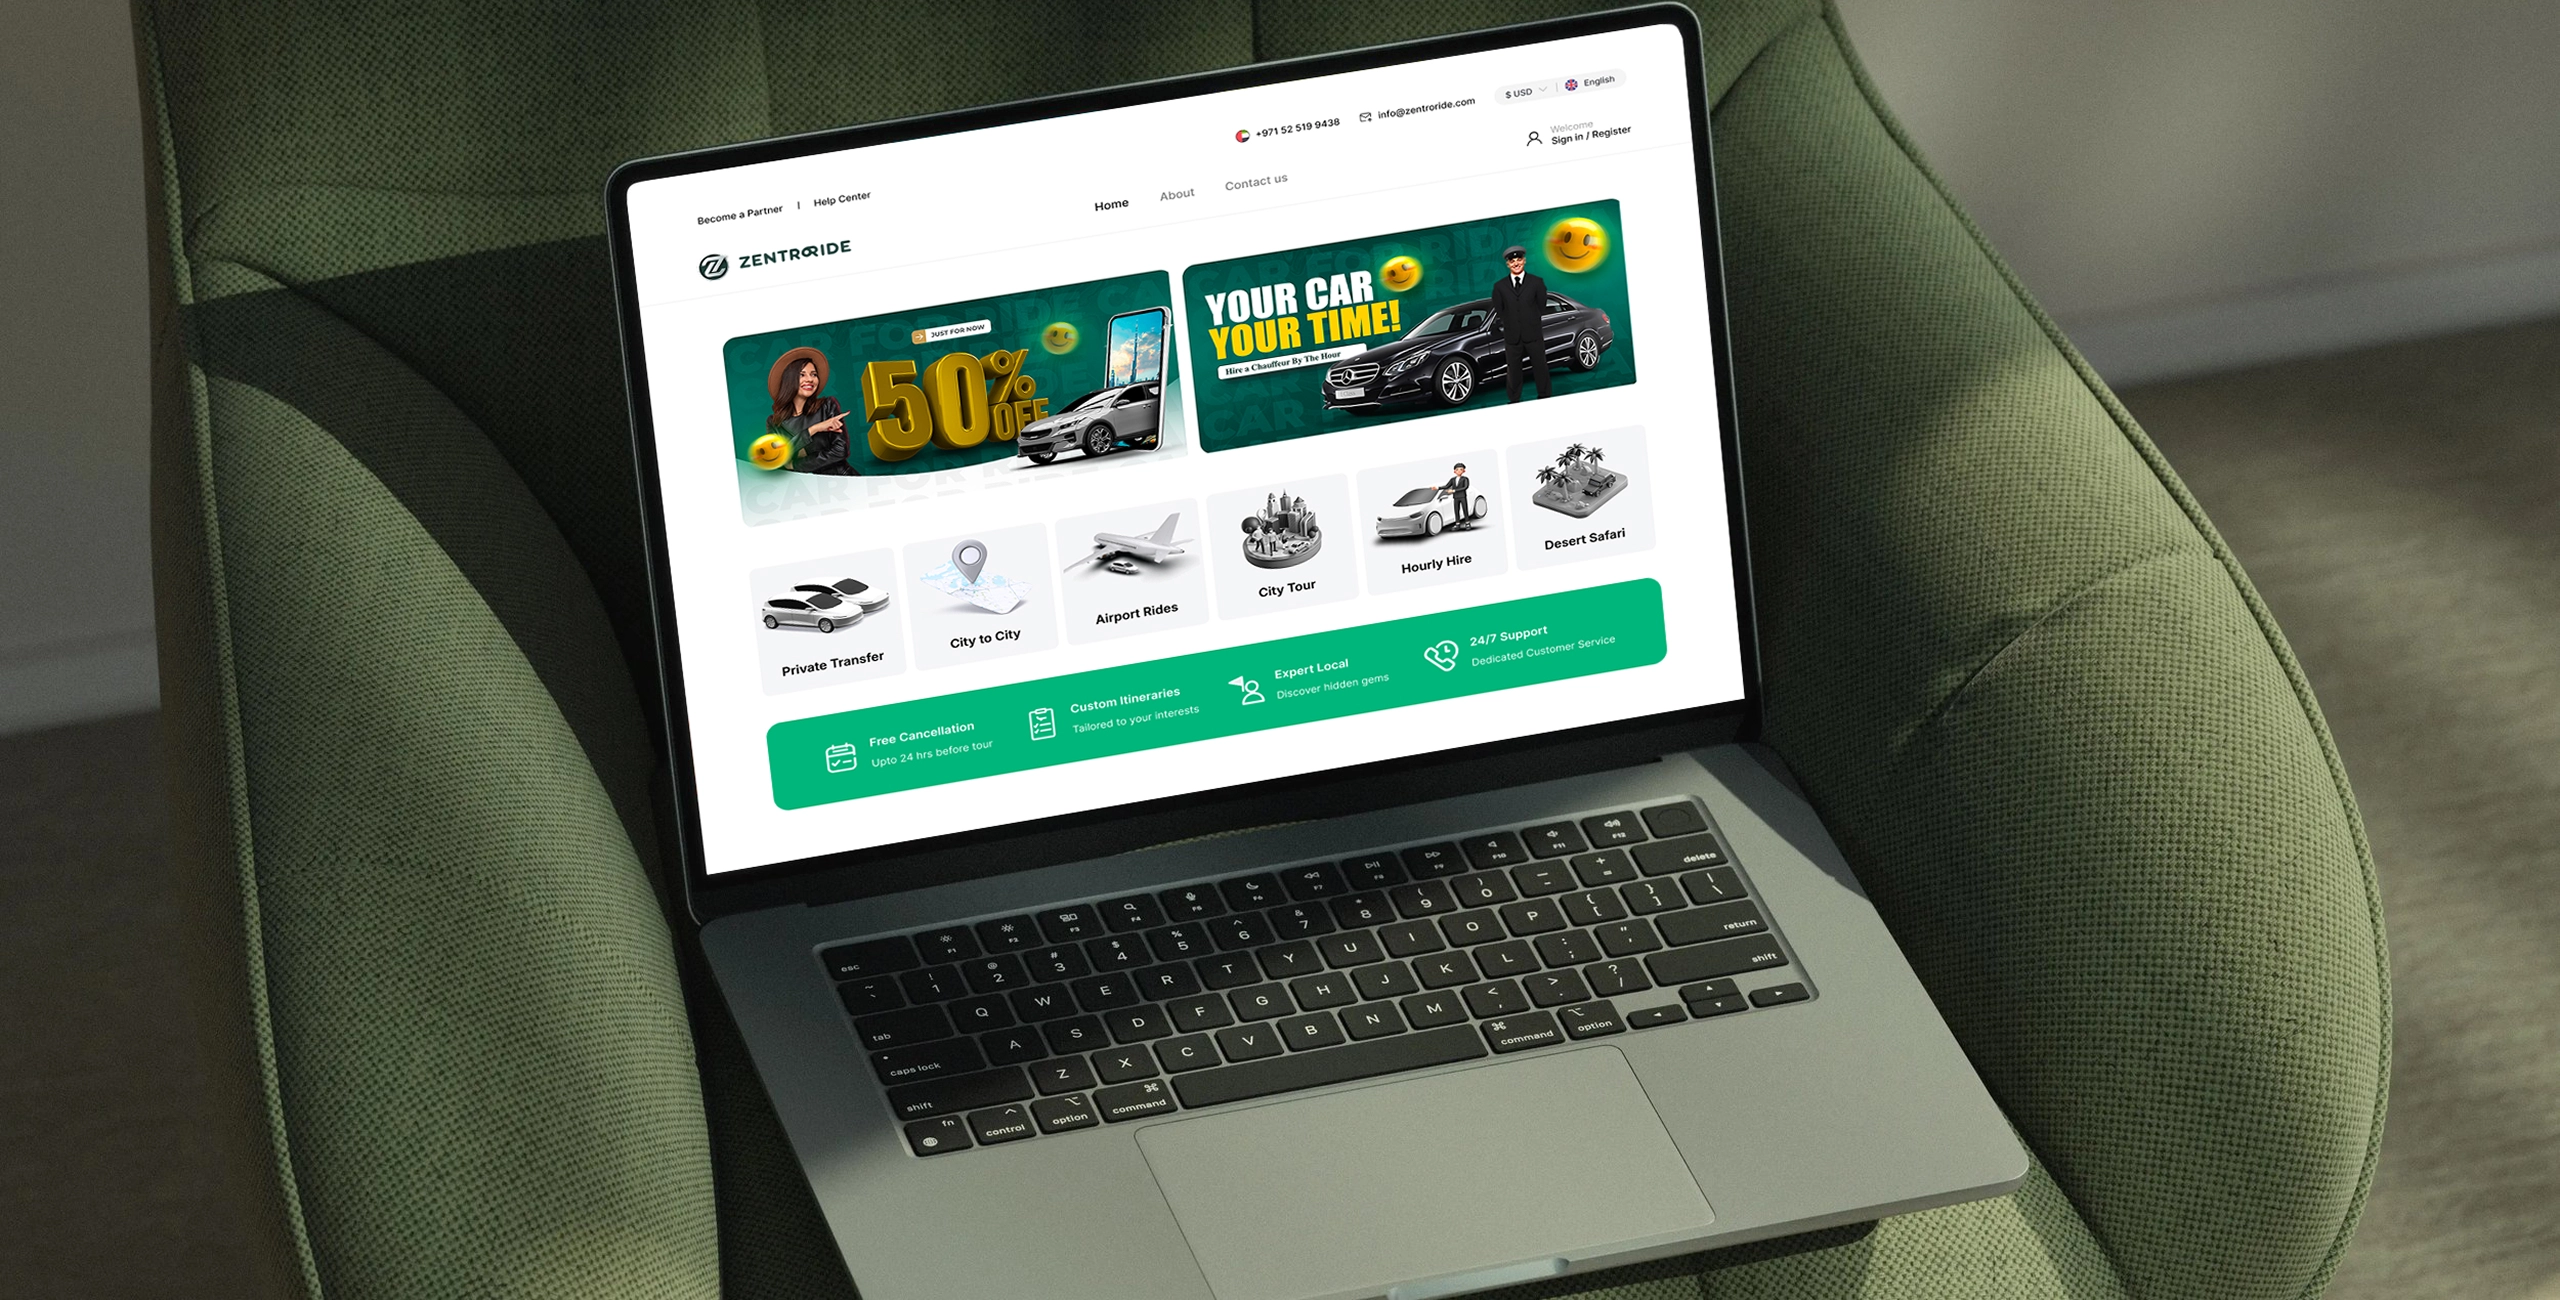
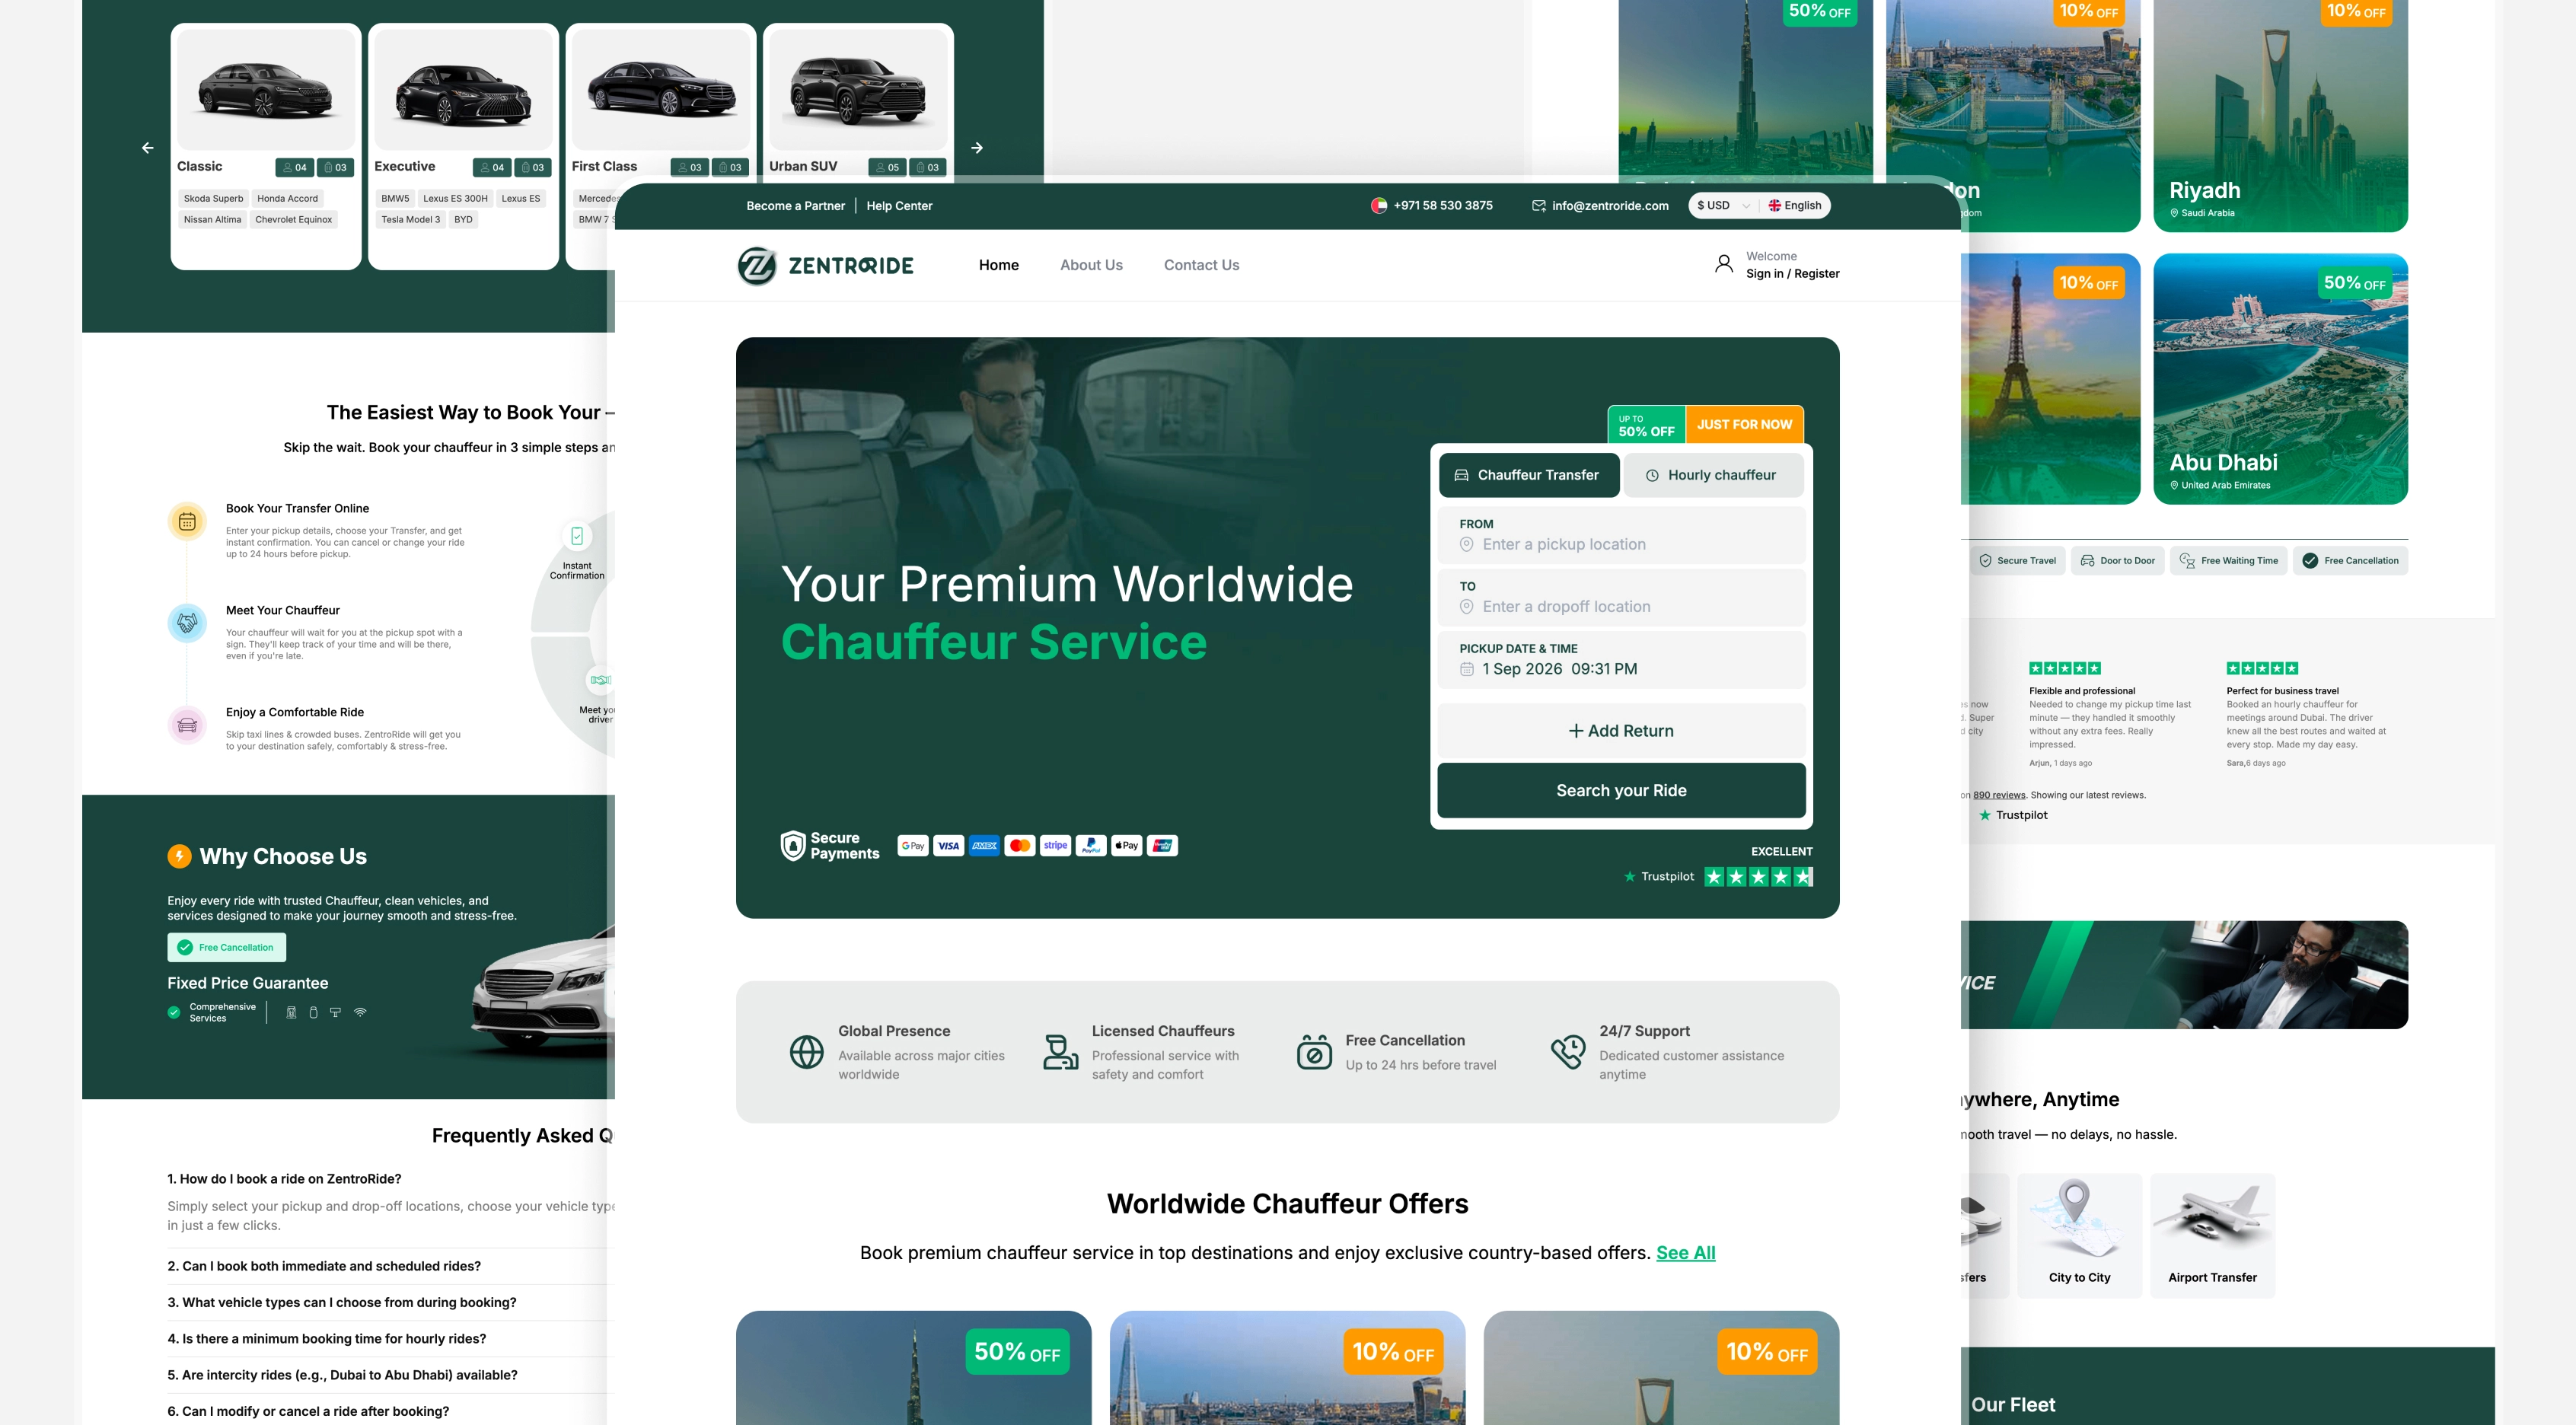
ZentroRide is a private mobility platform for fixed-price transfers, airport pickups, chauffeur hire, city tours, and fleet operations across the UAE and UK. I designed the product experience across the public website, booking flow, rider dashboard, driver dashboard, fleet partner dashboard, and admin dashboard.
The work moved ZentroRide from manual phone and WhatsApp coordination into a structured booking and operations platform.
Before ZentroRide
Before this project, ZentroRide ran almost entirely through phone calls and WhatsApp.
One or two agents took booking requests, checked driver availability by phone, and quoted prices verbally. There was no functional booking website, no self-serve flow, and no reliable operational record of each ride. Growth exposed the problem. Demand had outgrown what two people could manage through chat and calls.
Product Problem
The problem was bigger than booking a ride online. Riders needed price clarity, vehicle capacity, pickup confidence, cancellation rules, and a record they could return to later. Drivers needed assignment visibility. Fleet partners needed document, payout, and eligibility clarity. Admin needed a way to manage bookings, exceptions, approvals, and support without relying on memory or scattered messages.
The product had to turn an informal service operation into a visible system.
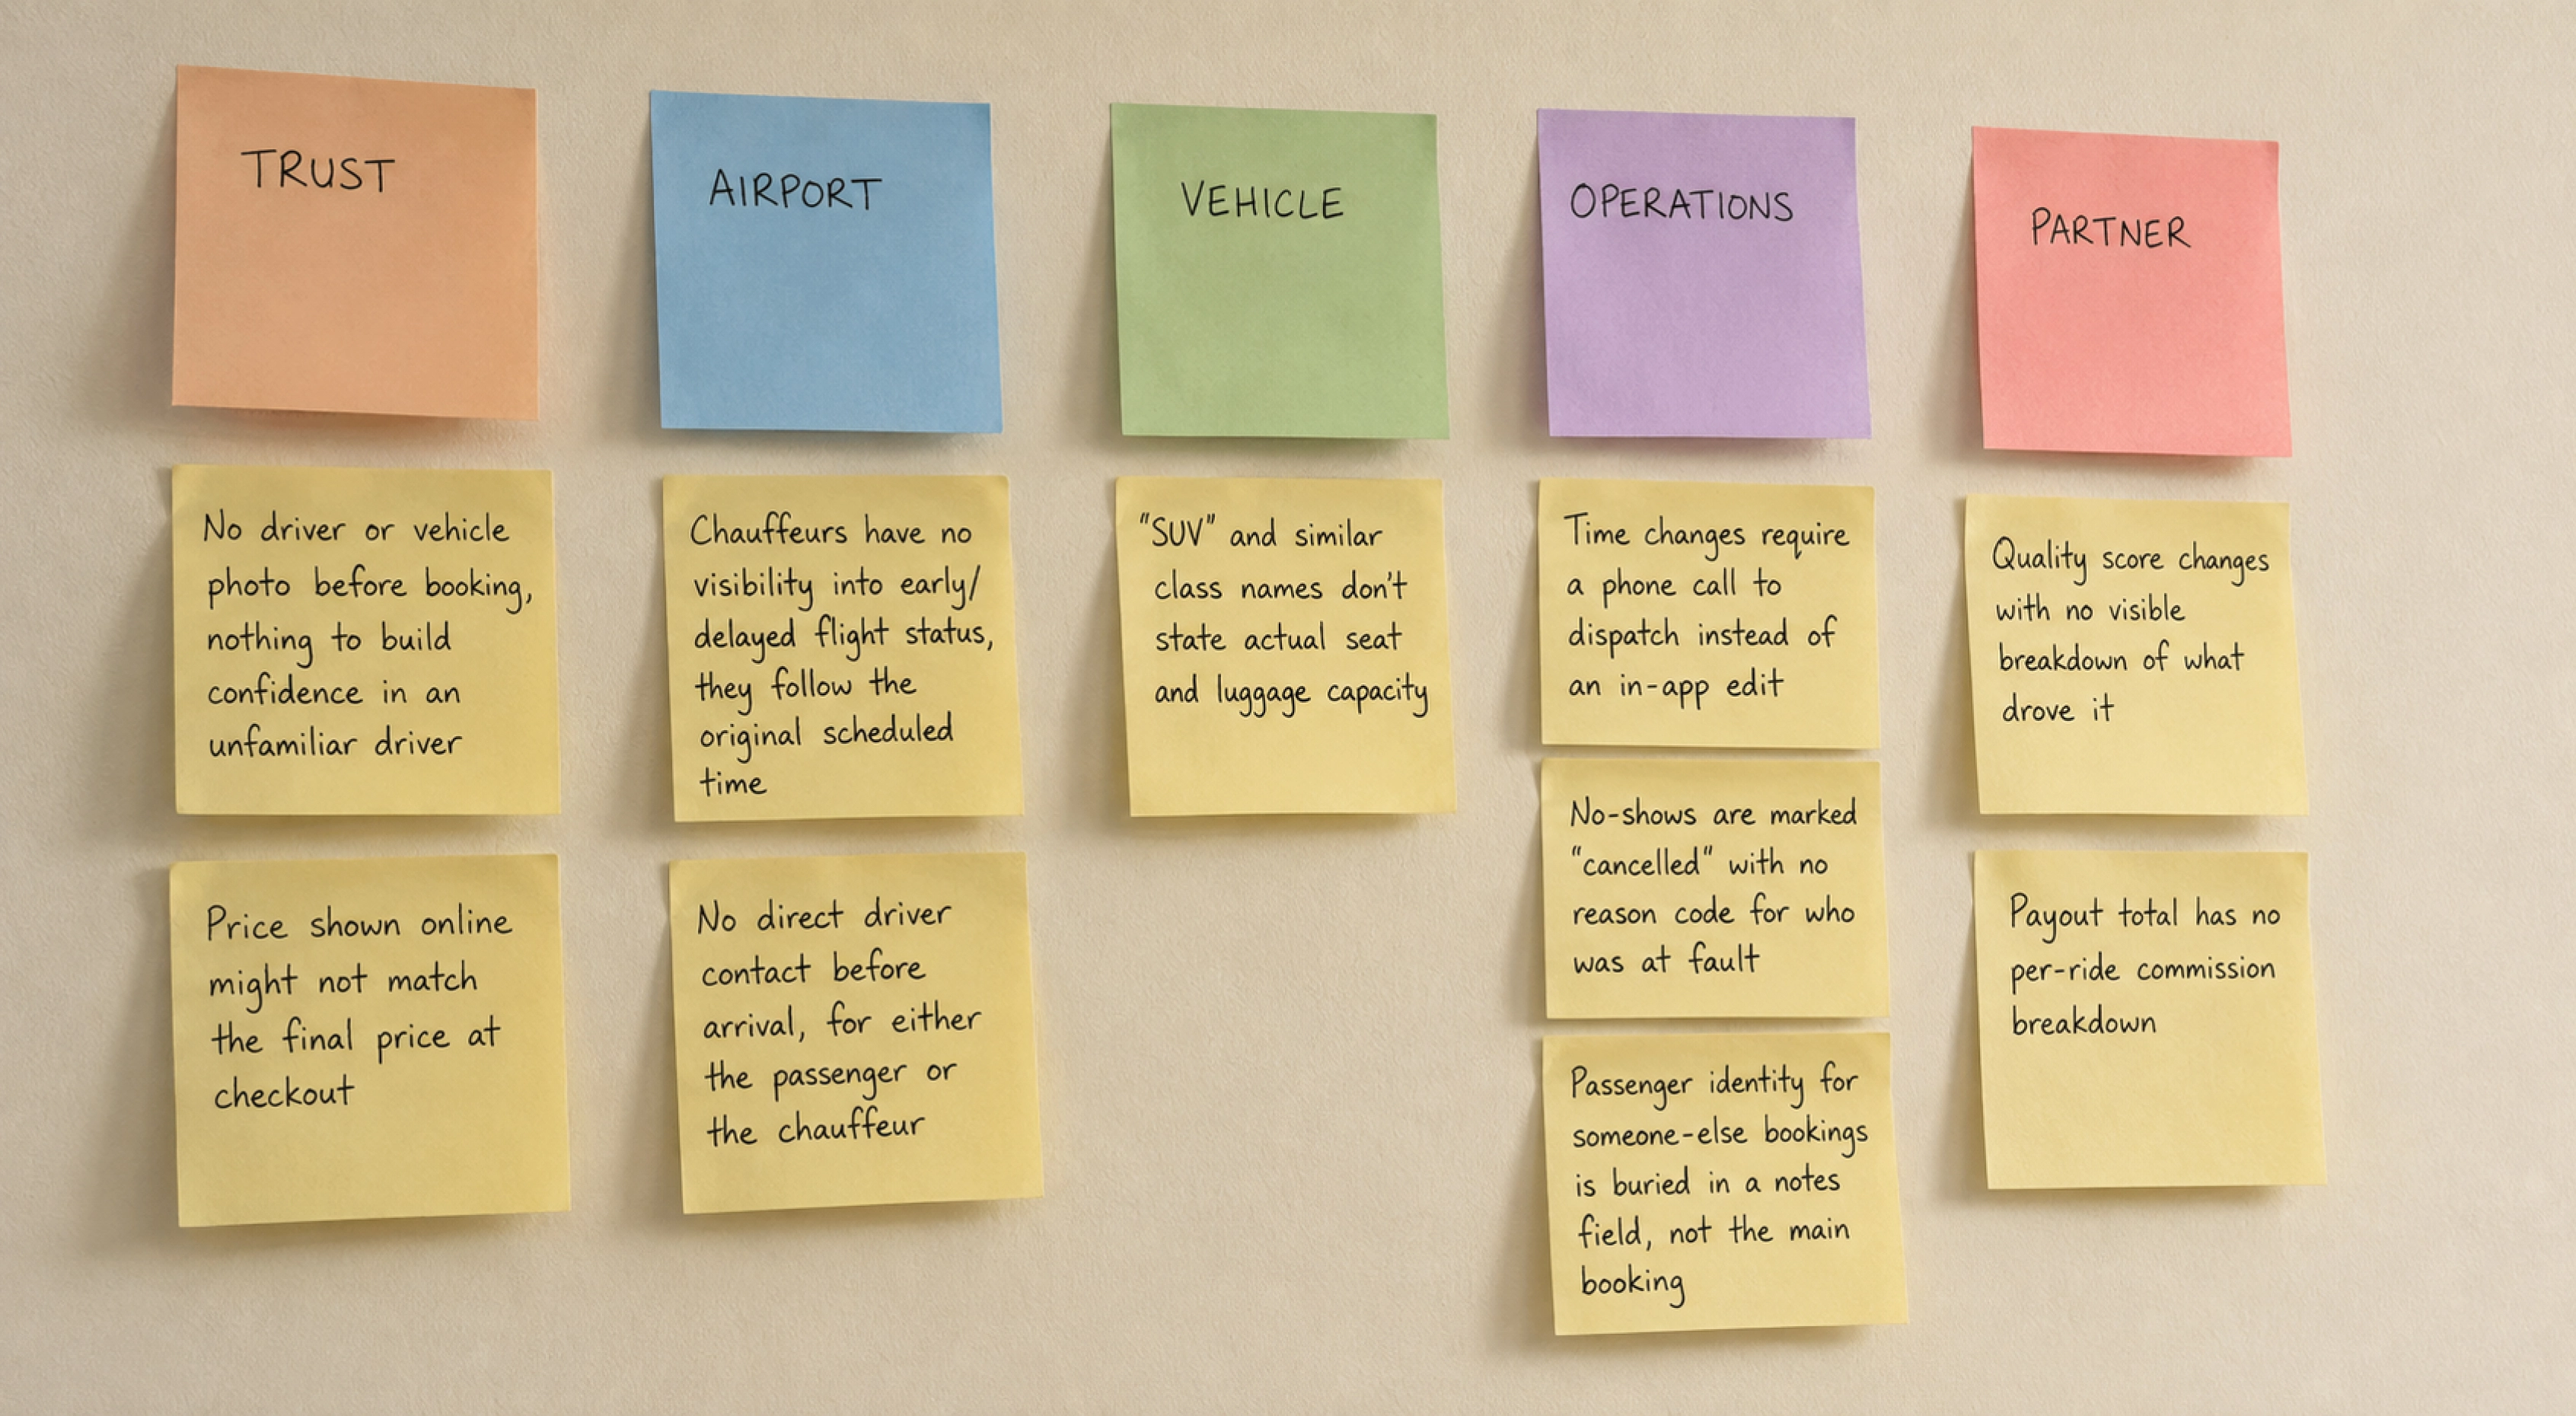
- Trust — No driver or vehicle photo before booking, nothing to build confidence in an unfamiliar driver. Price shown online might not match the final price at checkout.
- Airport — Chauffeurs have no visibility into early or delayed flight status; they follow the original scheduled time. No direct driver contact before arrival, for either the passenger or the chauffeur.
- Vehicle — “SUV” and similar class names don’t state actual seat and luggage capacity.
- Operations — Time changes require a phone call to dispatch instead of an in-app edit. No-shows are marked “cancelled” with no reason code for who was at fault. Passenger identity for someone-else bookings is buried in a notes field, not the main booking.
- Partner — Quality score changes with no visible breakdown of what drove it. Payout total has no per-ride commission breakdown.
Who It Serves
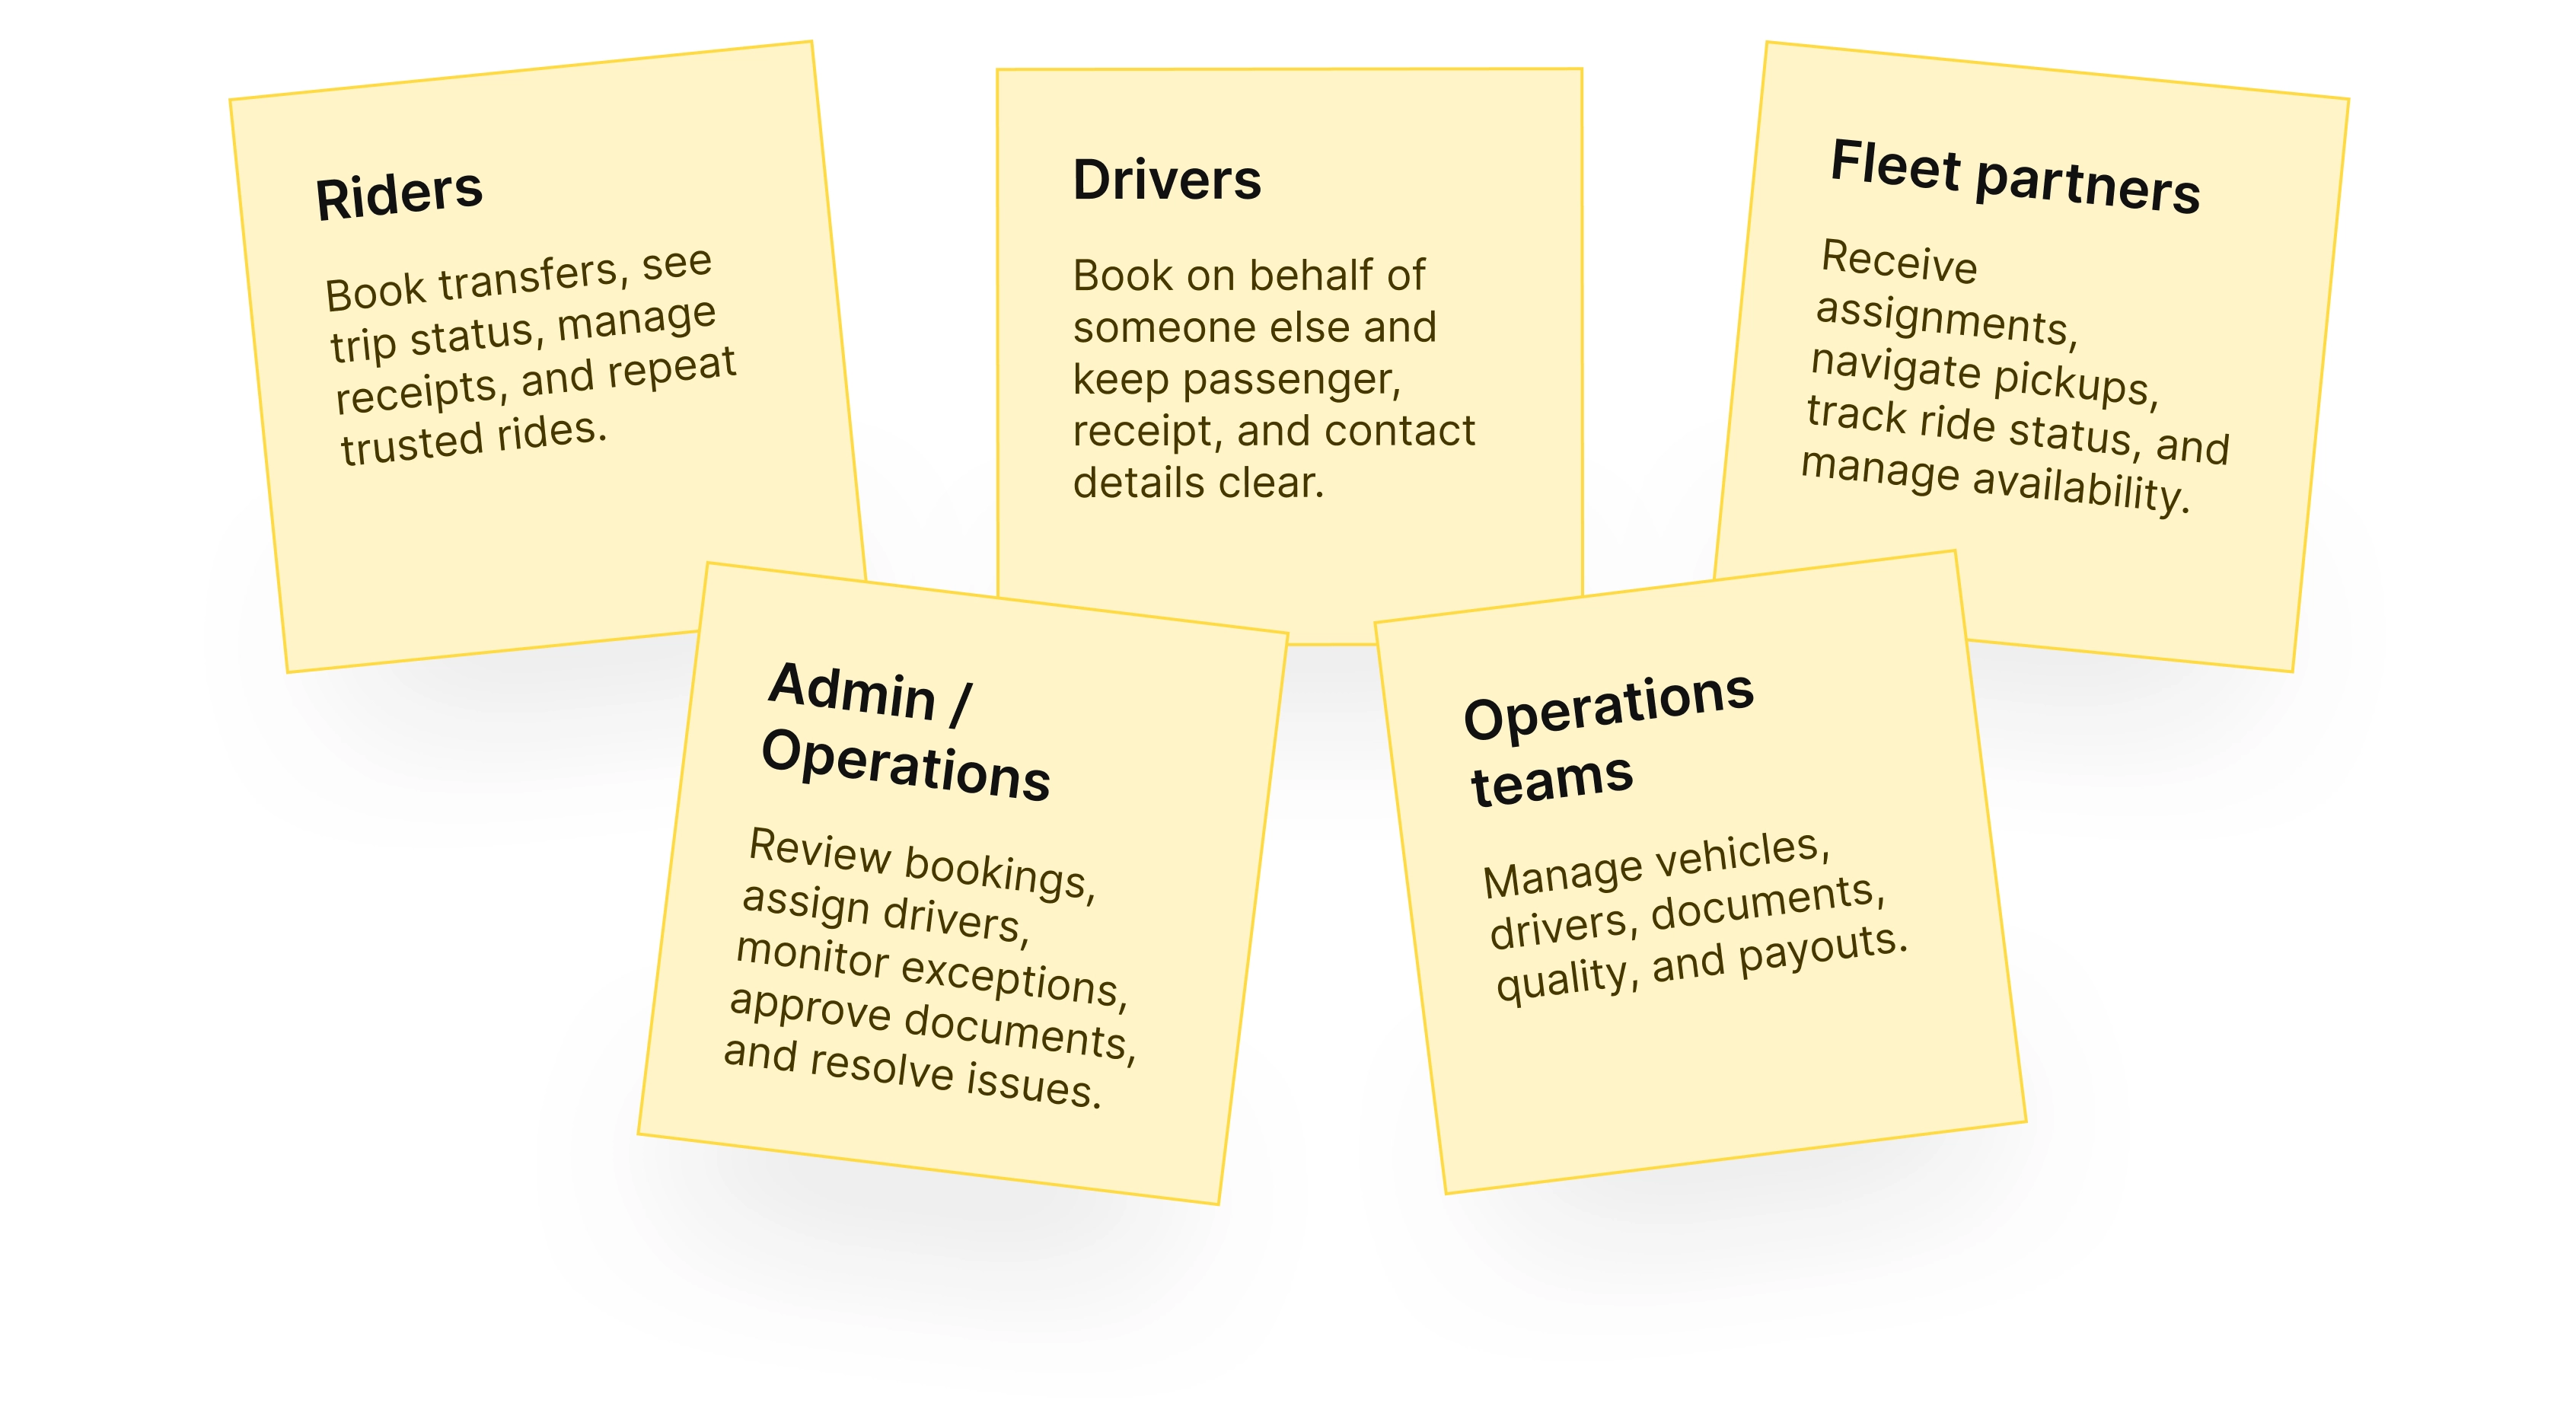
- Riders — Book transfers, see trip status, manage receipts, and repeat trusted rides.
- Drivers — Book on behalf of someone else and keep passenger, receipt, and contact details clear.
- Fleet partners — Receive assignments, navigate pickups, track ride status, and manage availability.
- Admin / Operations — Review bookings, assign drivers, monitor exceptions, approve documents, and resolve issues.
- Operations teams — Manage vehicles, drivers, documents, quality, and payouts.
Research Direction
The research pointed to the same themes across interviews, usability testing, and survey results:
- Price uncertainty before payment
- Vehicle capacity confusion
- Airport pickup anxiety
- Weak support for booking on behalf of someone else
- Operational gaps around cancellations, reassignments, documents, and payouts
The survey confirmed the priority: 74% would pay a premium for guaranteed fixed pricing, and 82% said exact vehicle capacity before booking mattered.
Product Architecture
ZentroRide became five connected surfaces sharing one operational backbone:
- Public website
- Rider dashboard
- Driver dashboard
- Fleet Partner Experience
- Admin dashboard

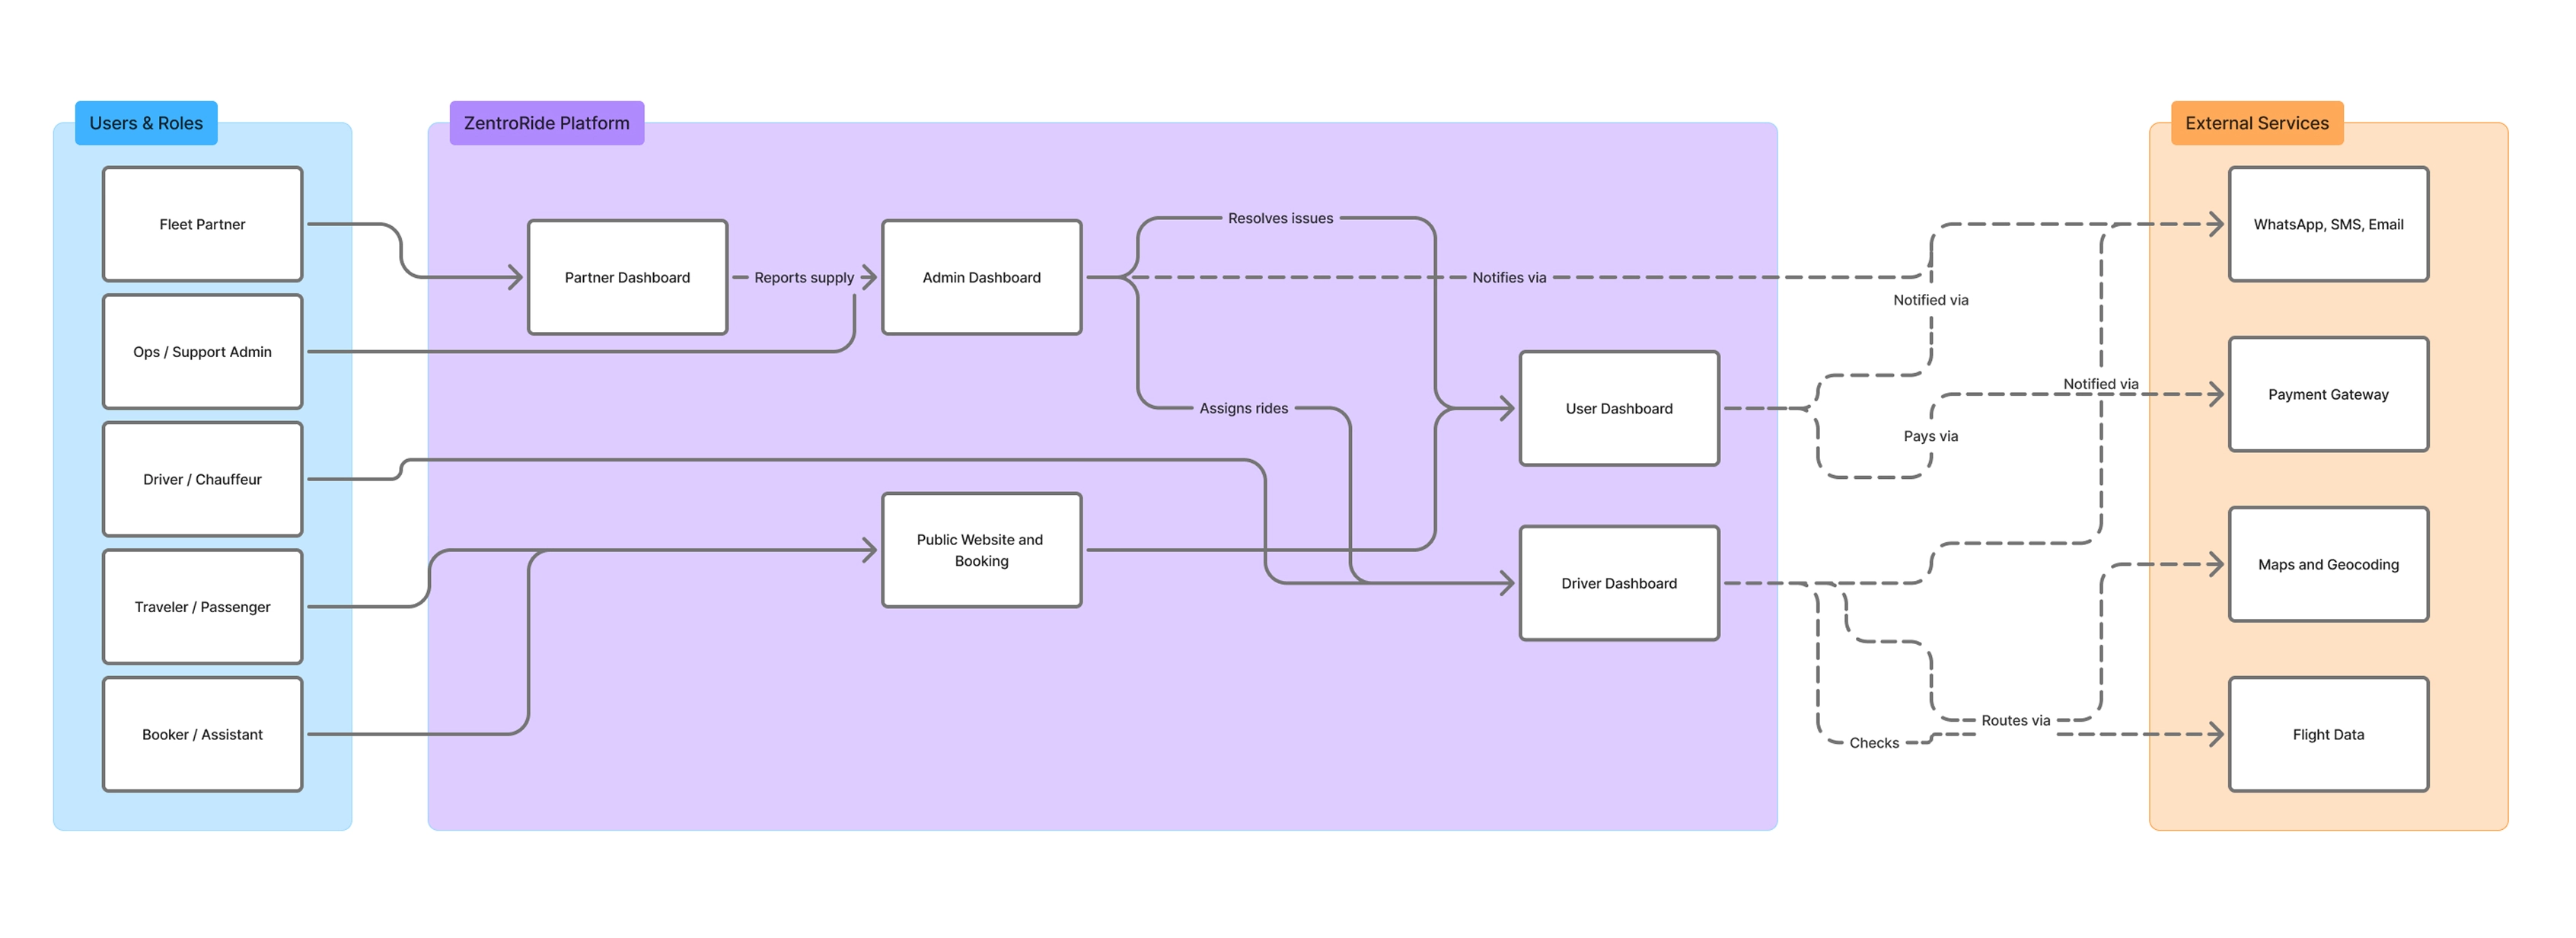
I mapped each surface separately first, then connected them through the information that moves between roles: booking details, payment, driver assignment, document approval, cancellation rules, trip status, and ride completion.
User Flows
I mapped the main rider flow from discovery to completed ride: quote, vehicle selection, booking details, payment, confirmation, driver assignment, pickup, ride completion, receipt, and rebooking.
Then I mapped the cross-role flow behind one booking: rider action, admin review, partner supply, driver assignment, external services, and notifications.
That helped make the hidden operational steps visible before they became product gaps.
Key Design Decisions
1. Show price before commitment
Fixed pricing was one of the strongest trust signals in the research. The booking flow needed to show the fare, inclusions, waiting time, and policy details before payment.
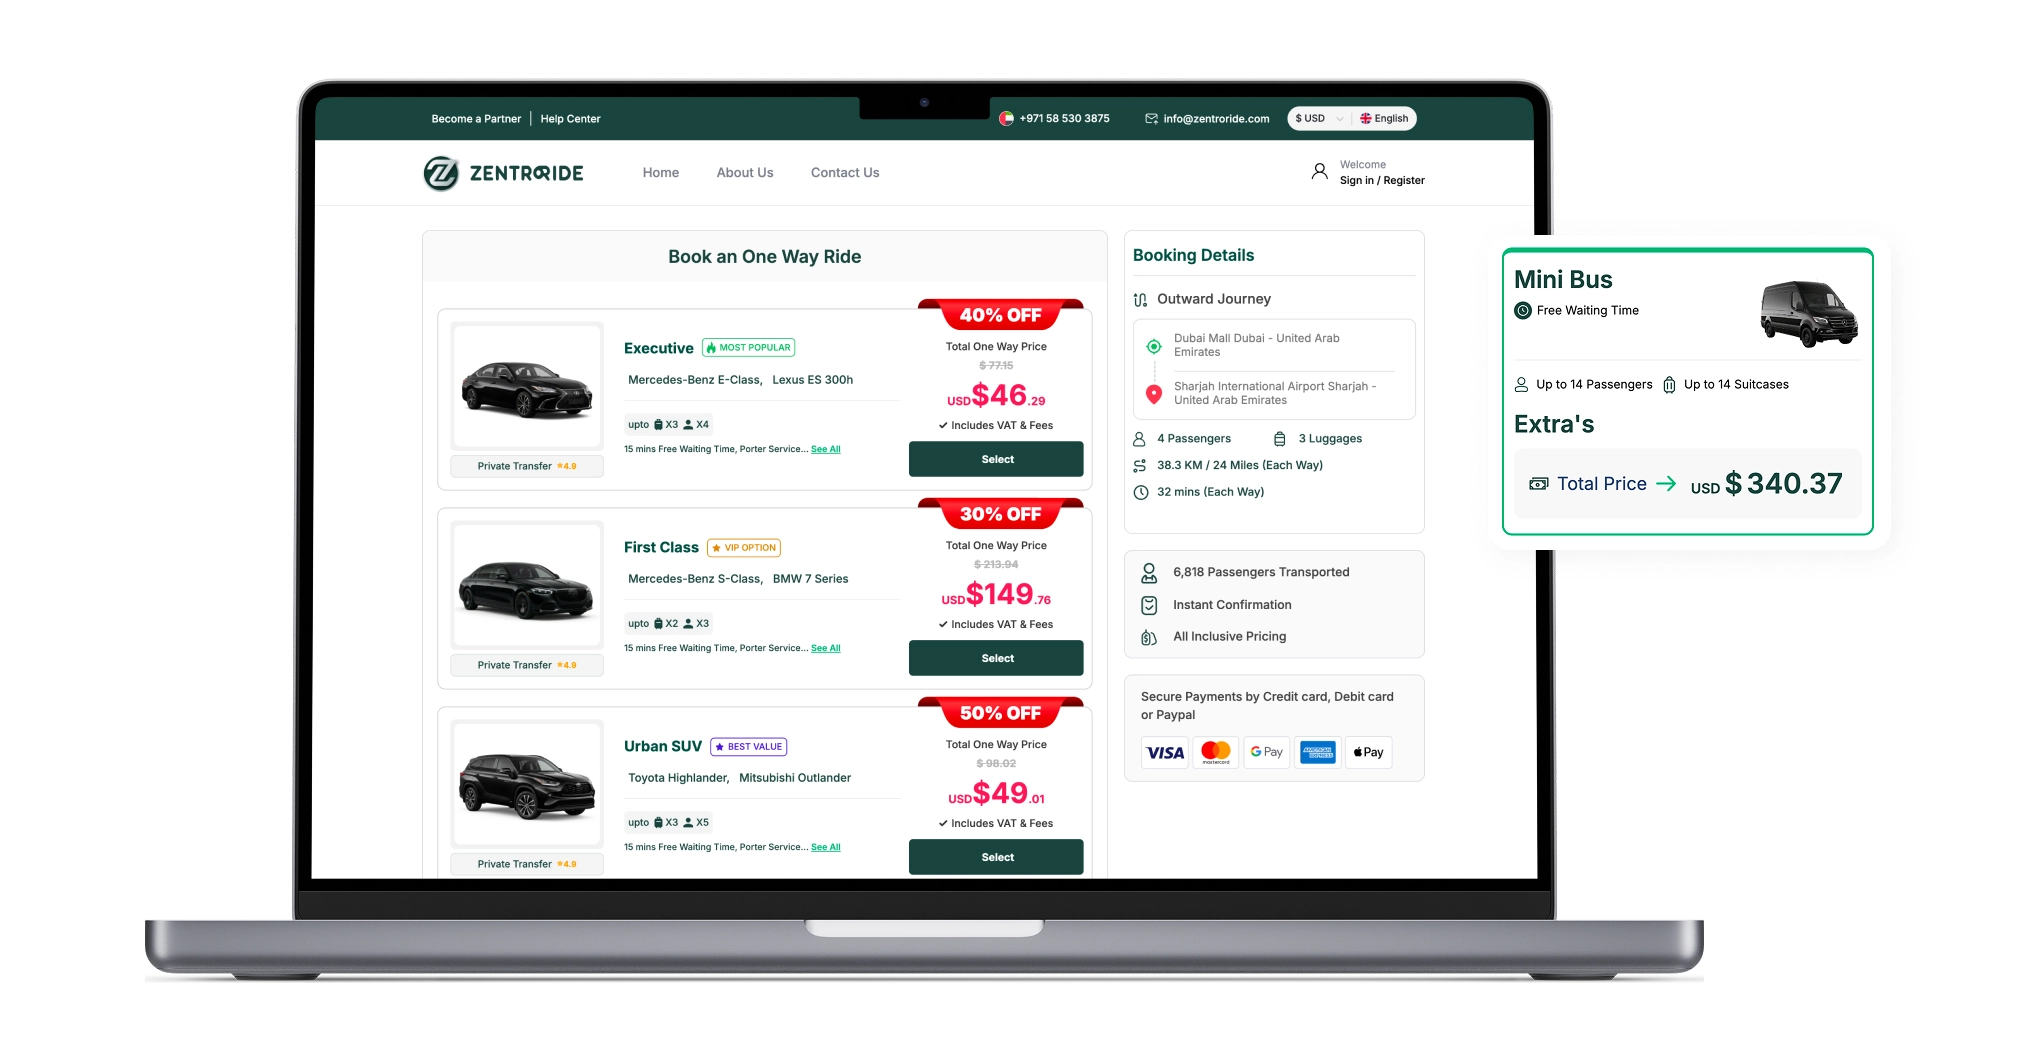
2. Make vehicle capacity explicit
Users did not trust labels like SUV or premium car on their own. Families and travelers wanted exact seat and luggage capacity before choosing. The vehicle selector was structured around real capacity, not only class names.
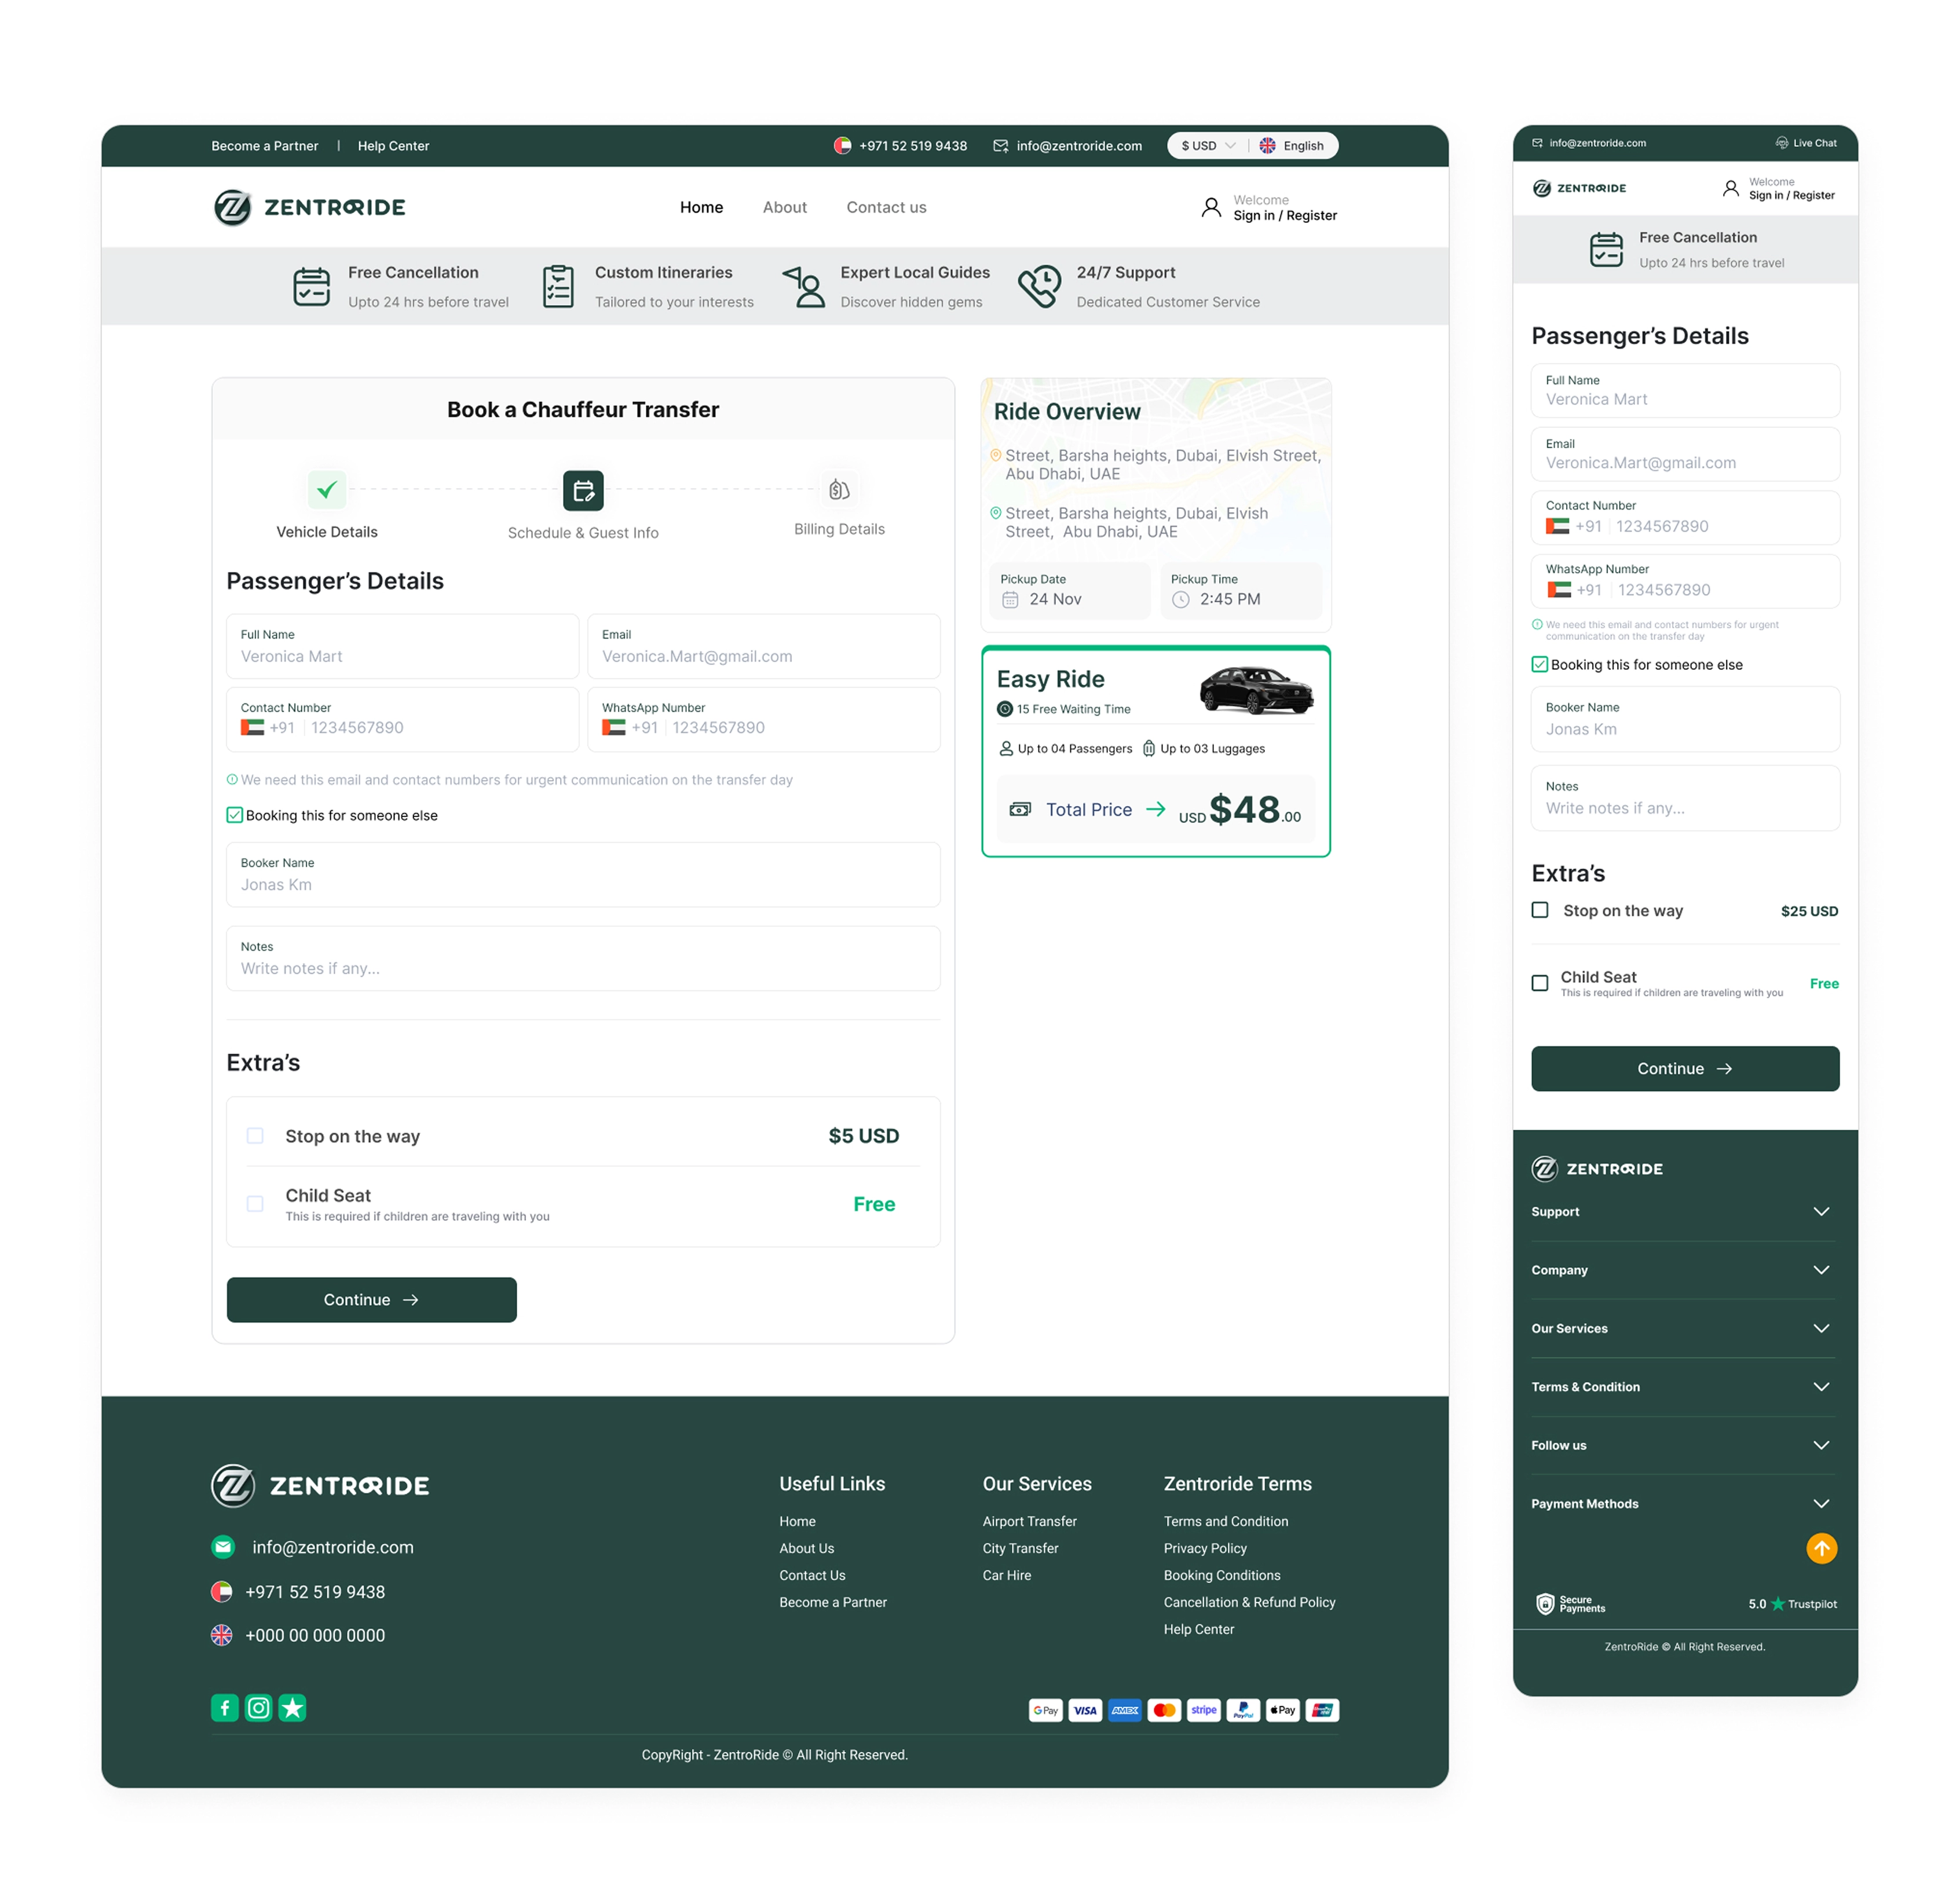
3. Support booker and passenger separately
Executive assistants often book rides for someone else. The old flow treated the booker and passenger as the same person, which pushed important details into notes. The new flow separated booker contact, passenger details, and receipt ownership.
4. Separate urgent admin work from records
Admin had two different jobs: handling live operations and managing platform records.
I separated the active operations queue from slower management areas like users, approvals, reports, and settings.
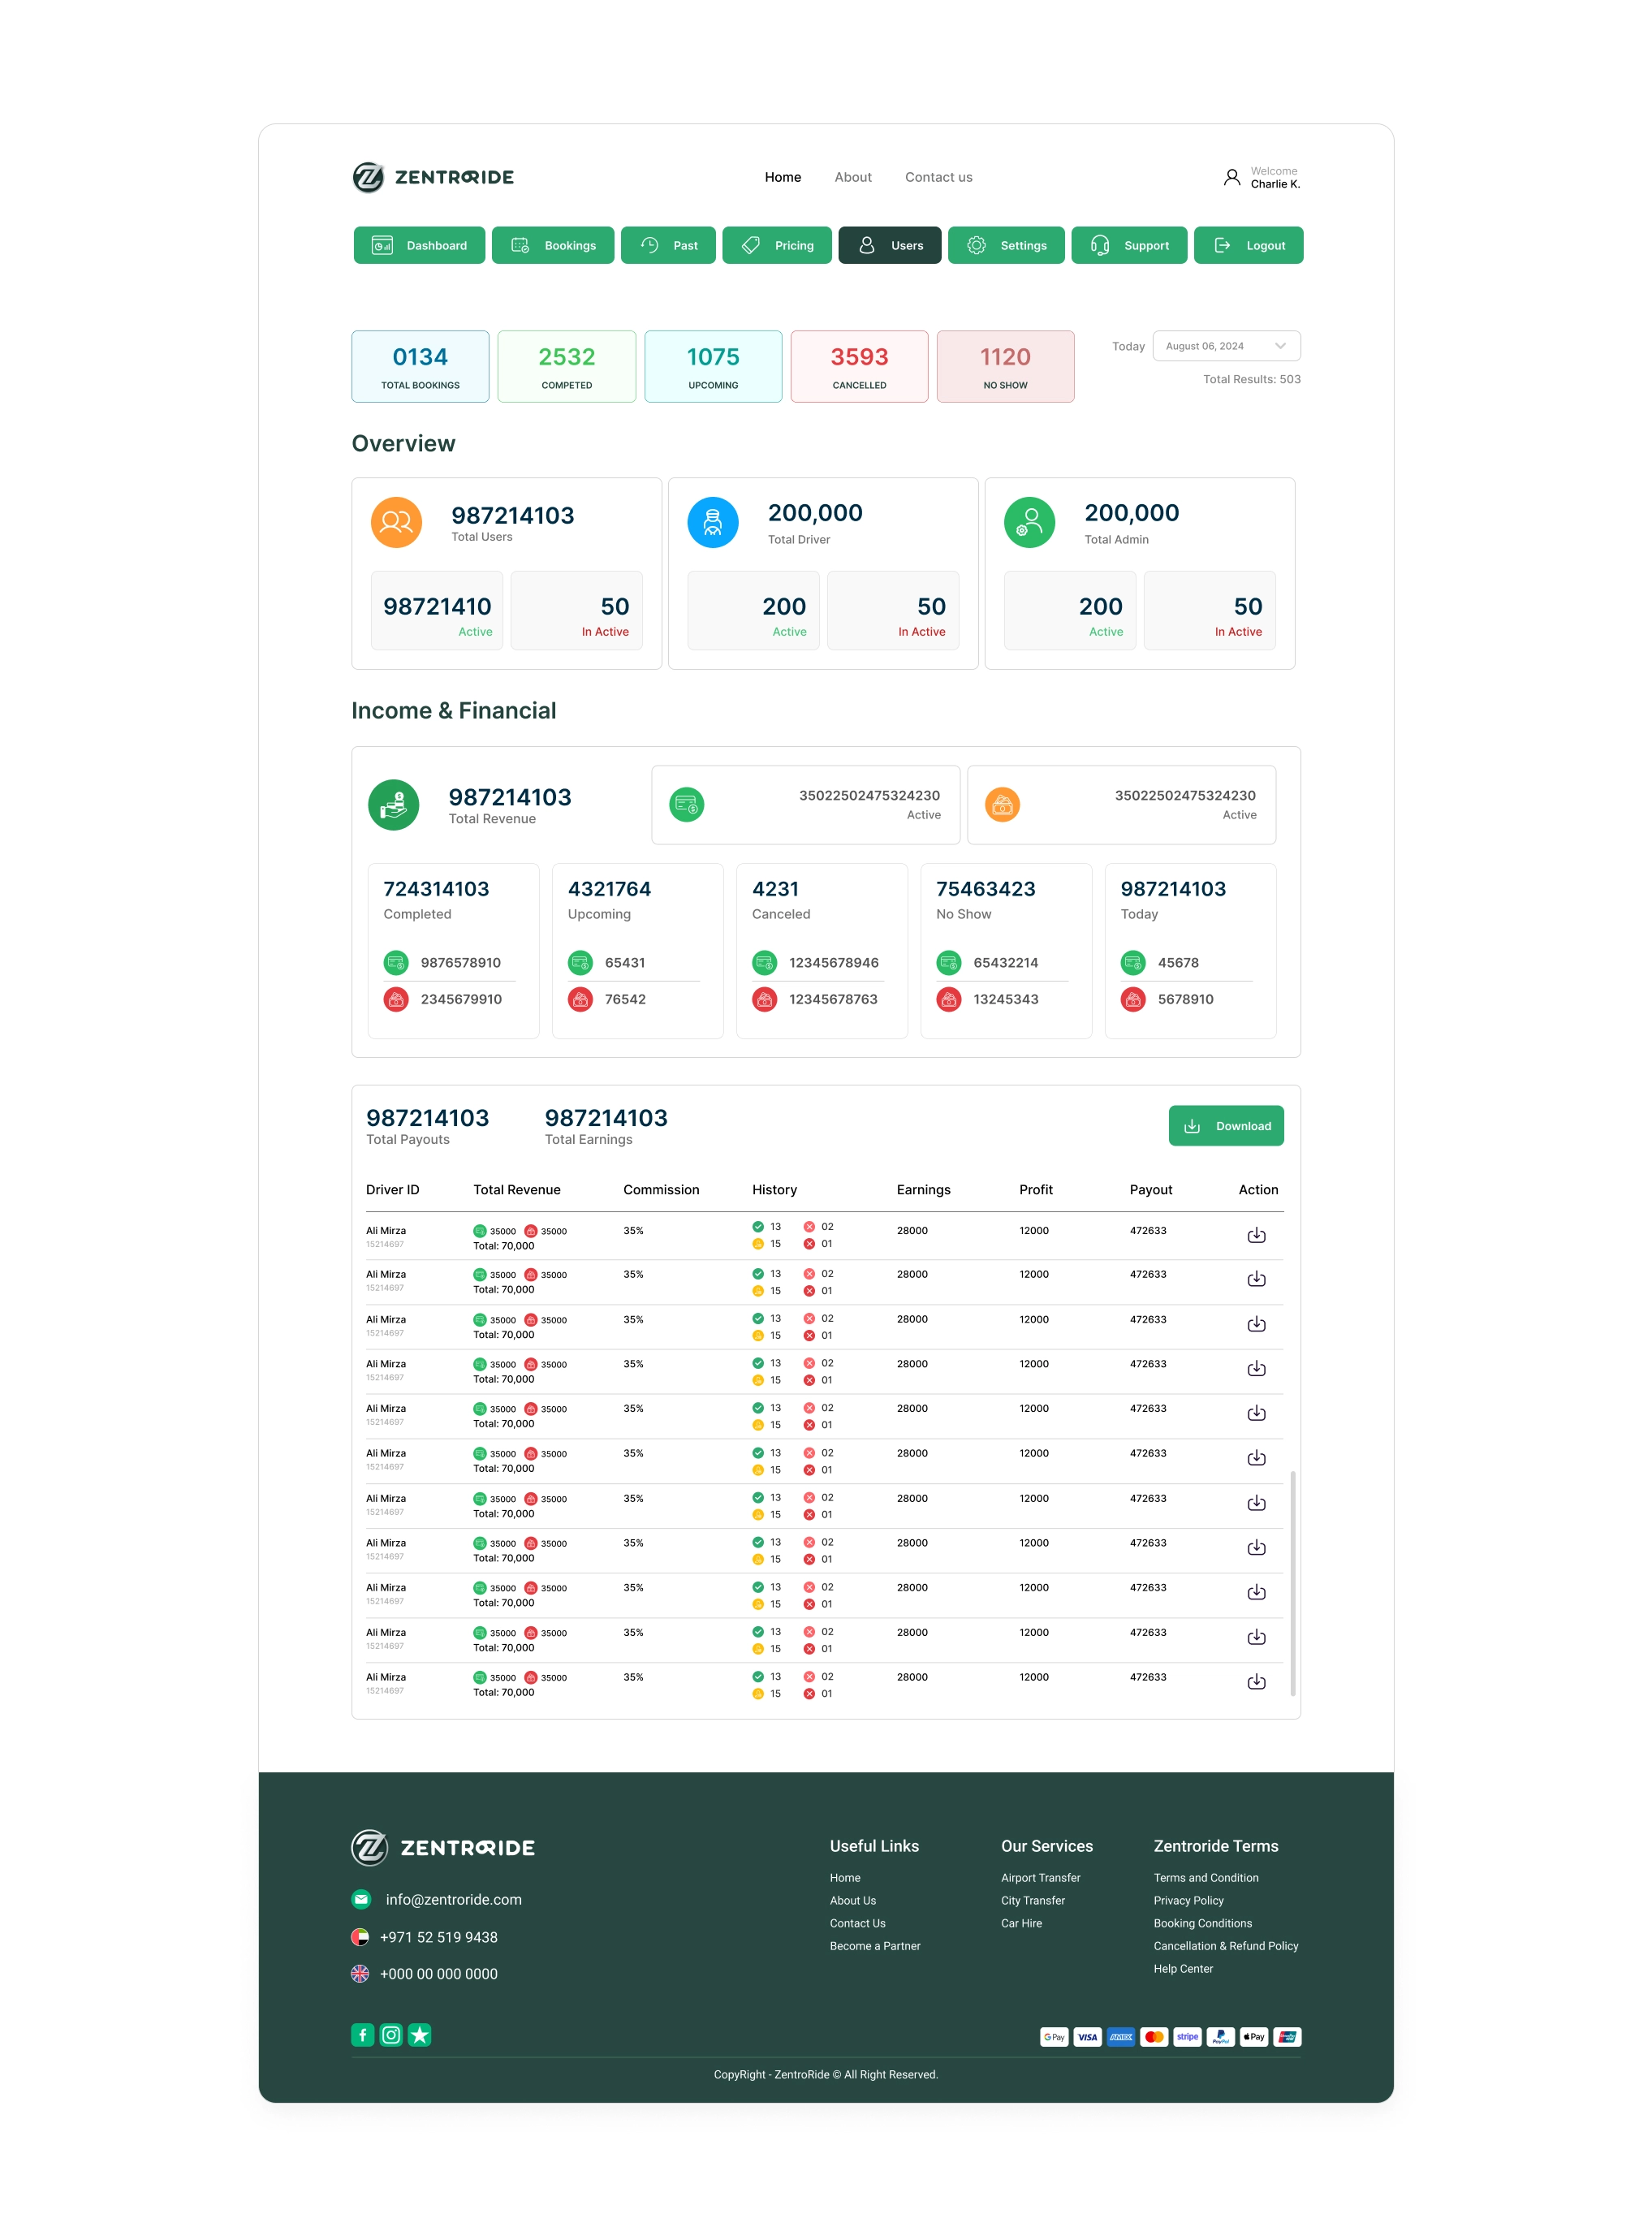
Role-Based Dashboards
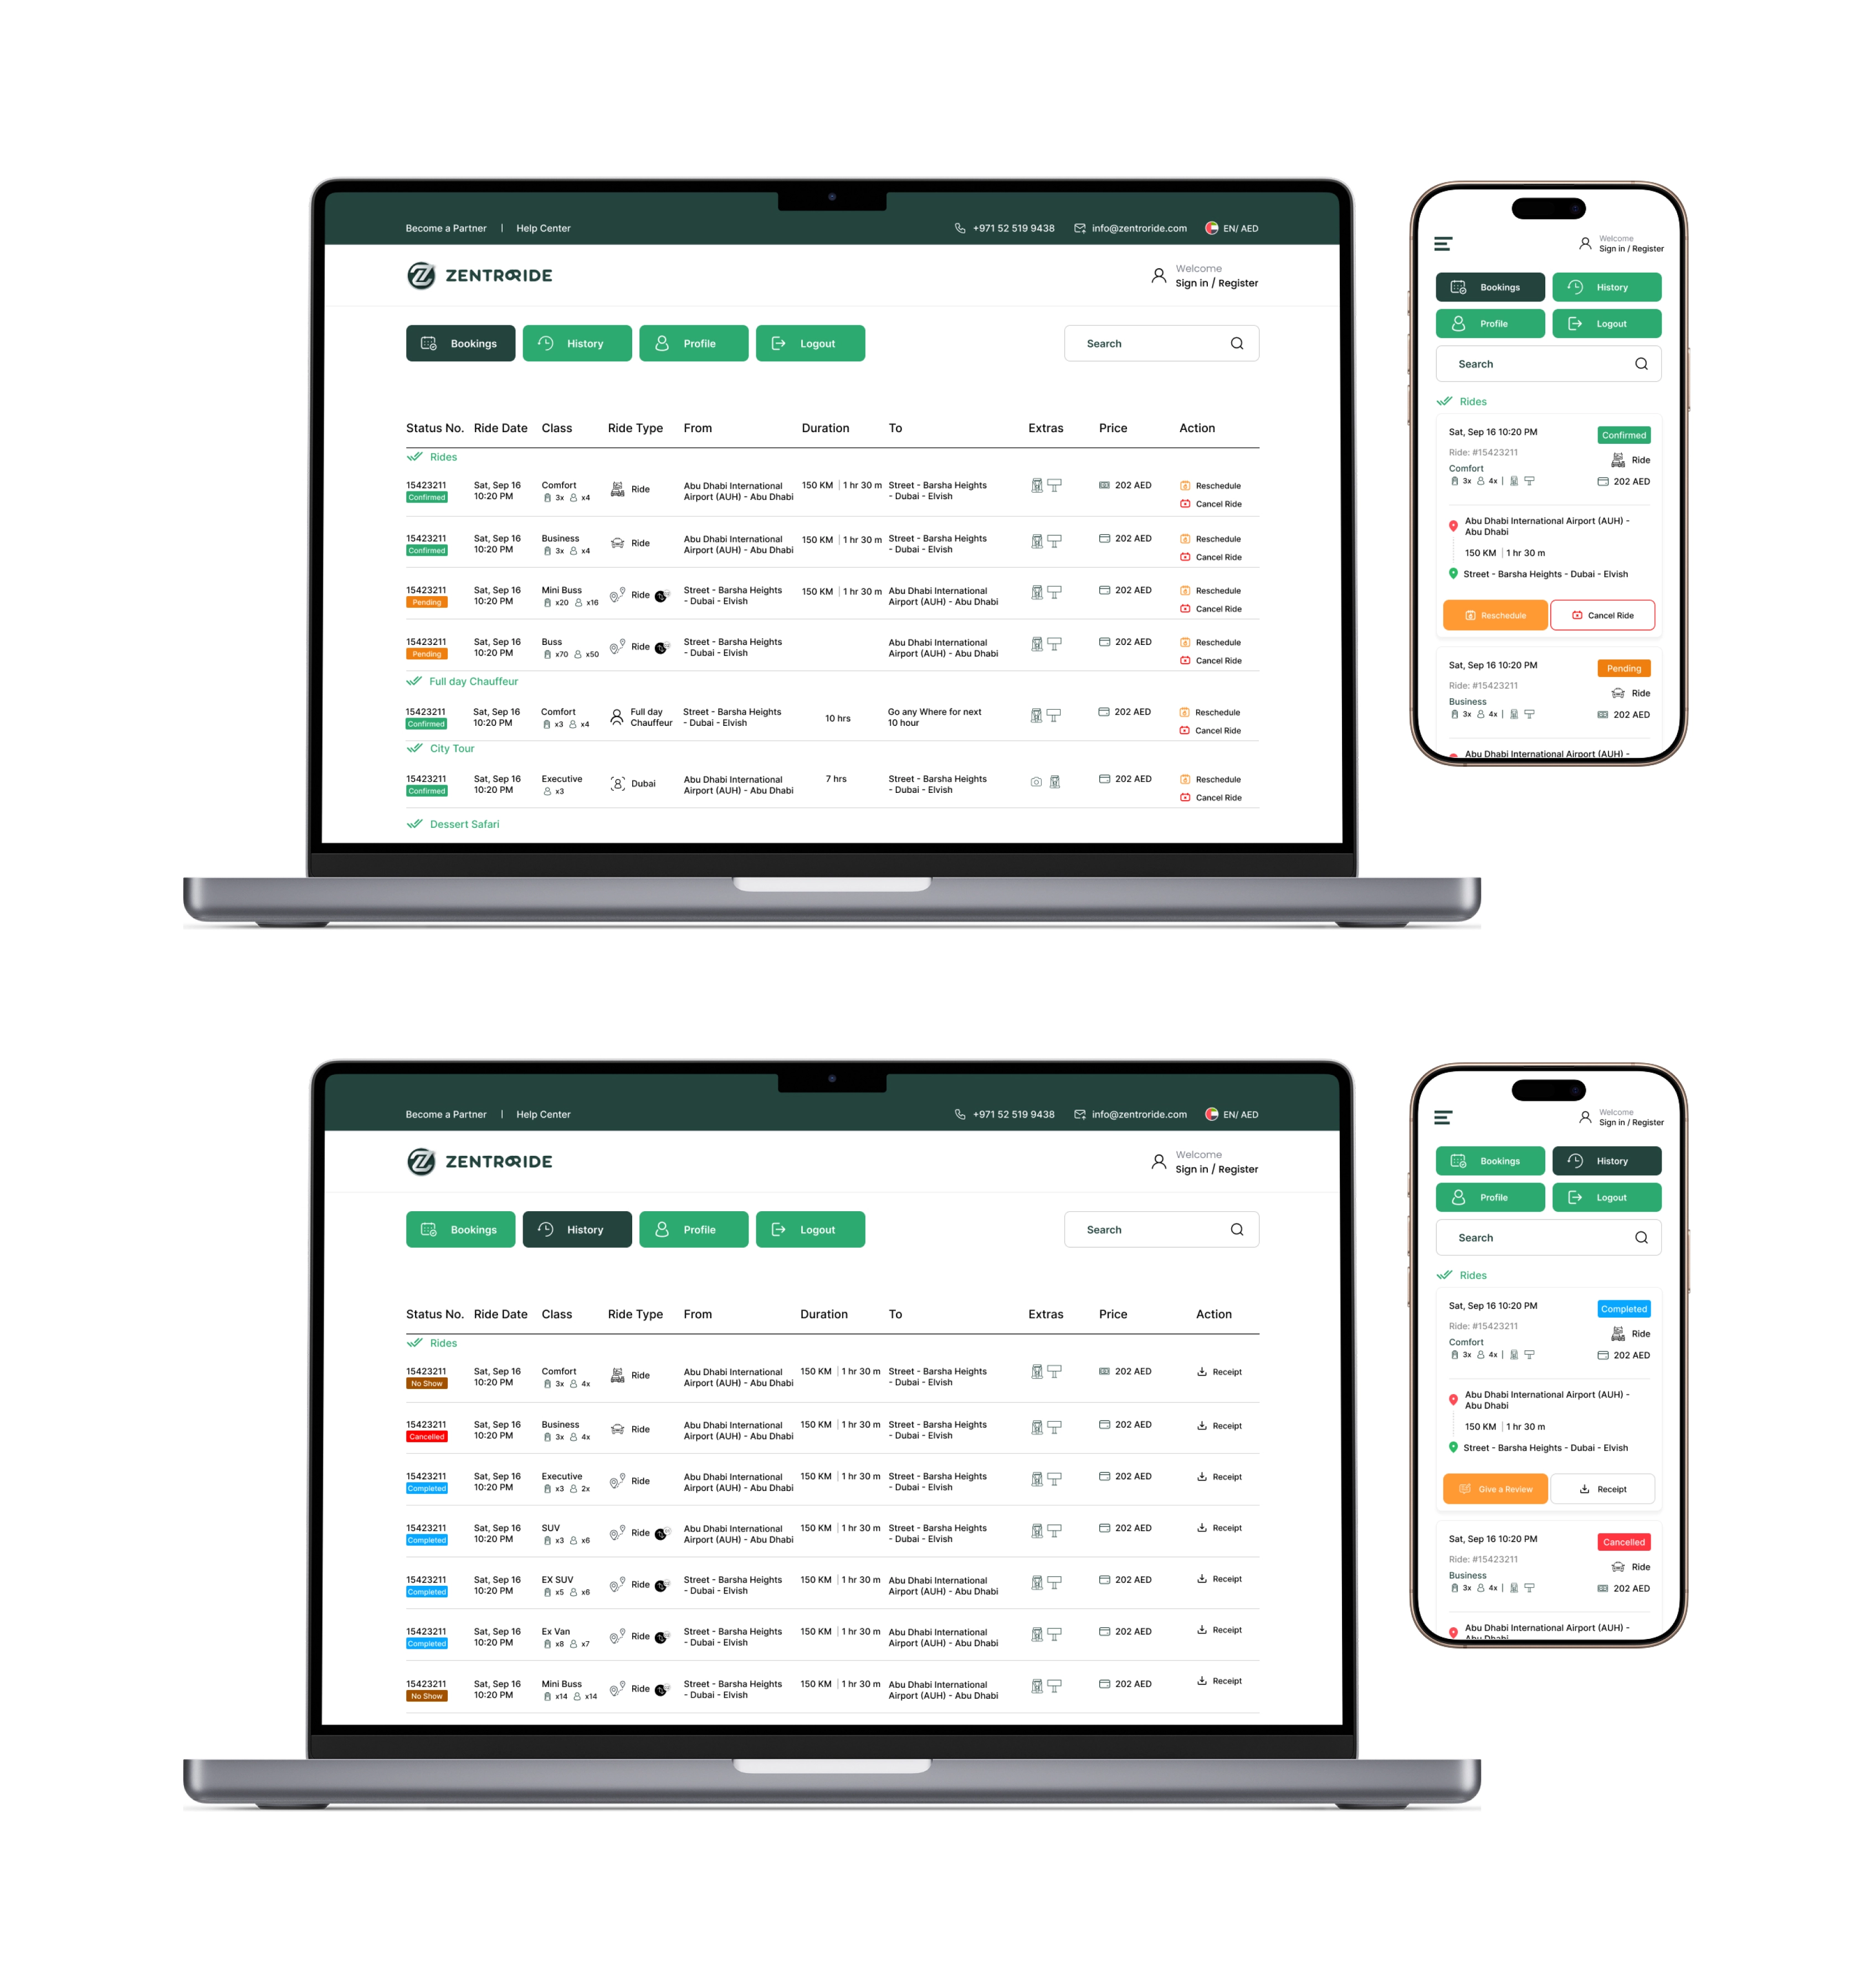
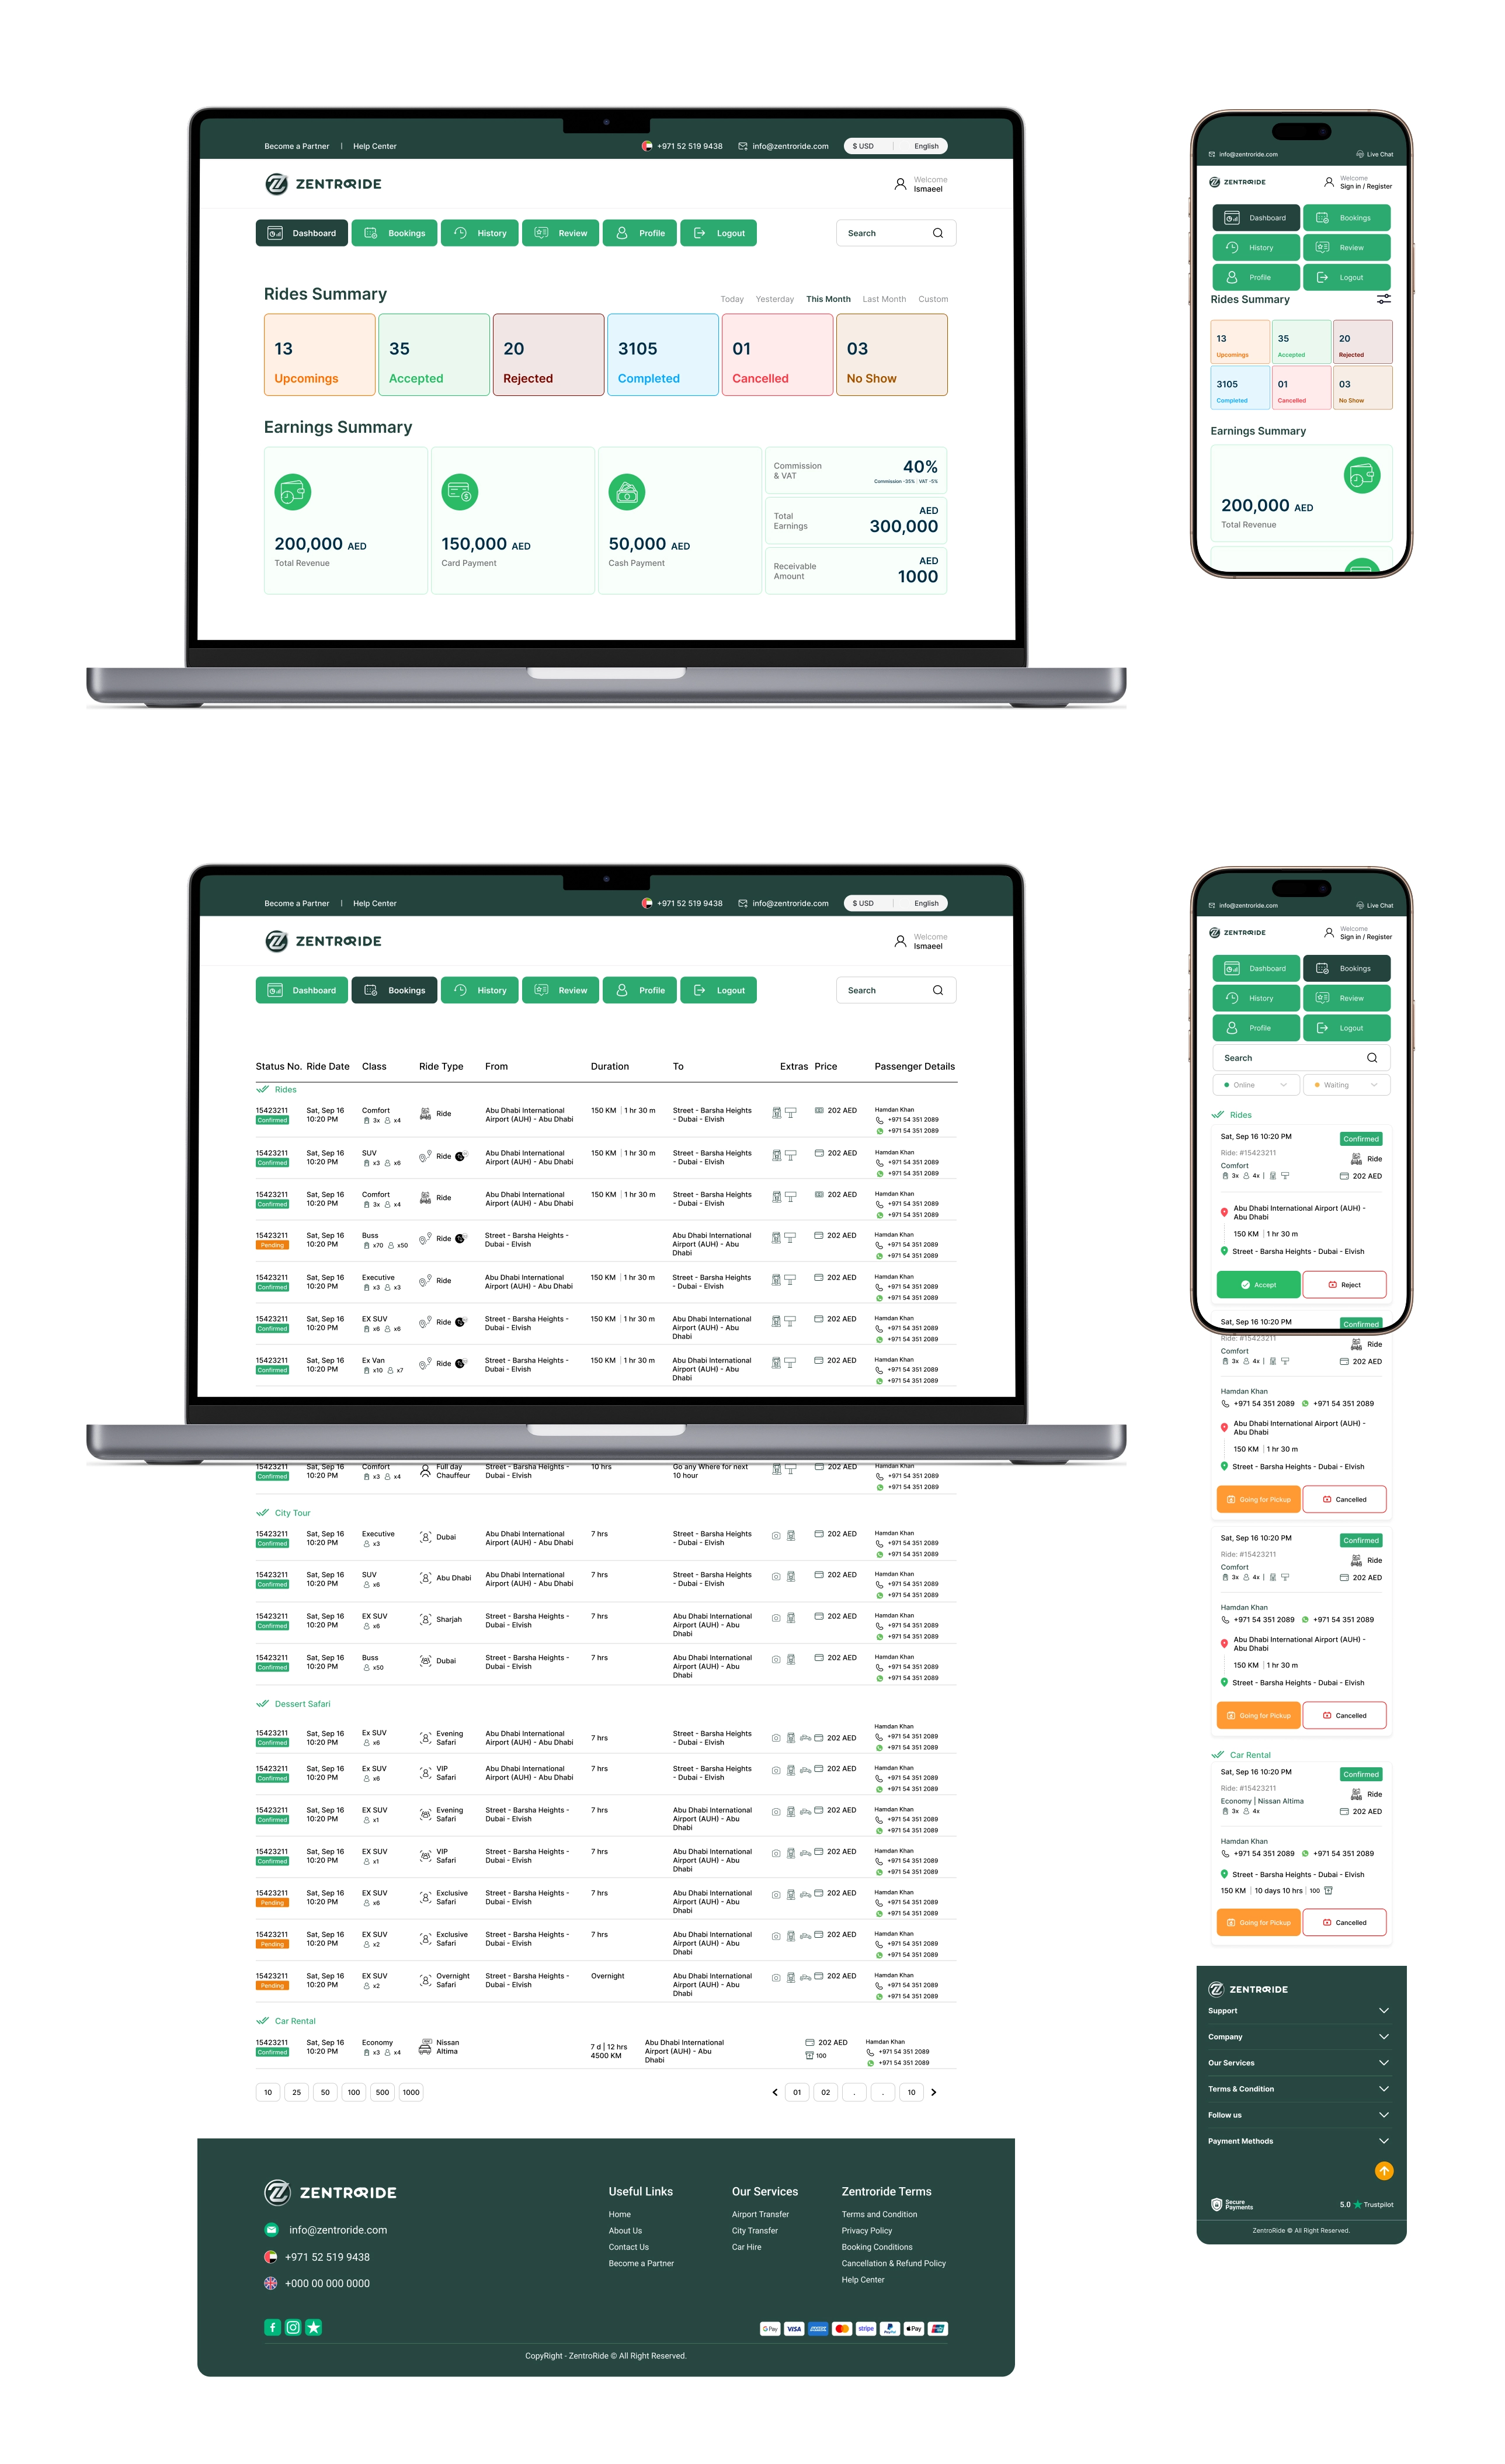
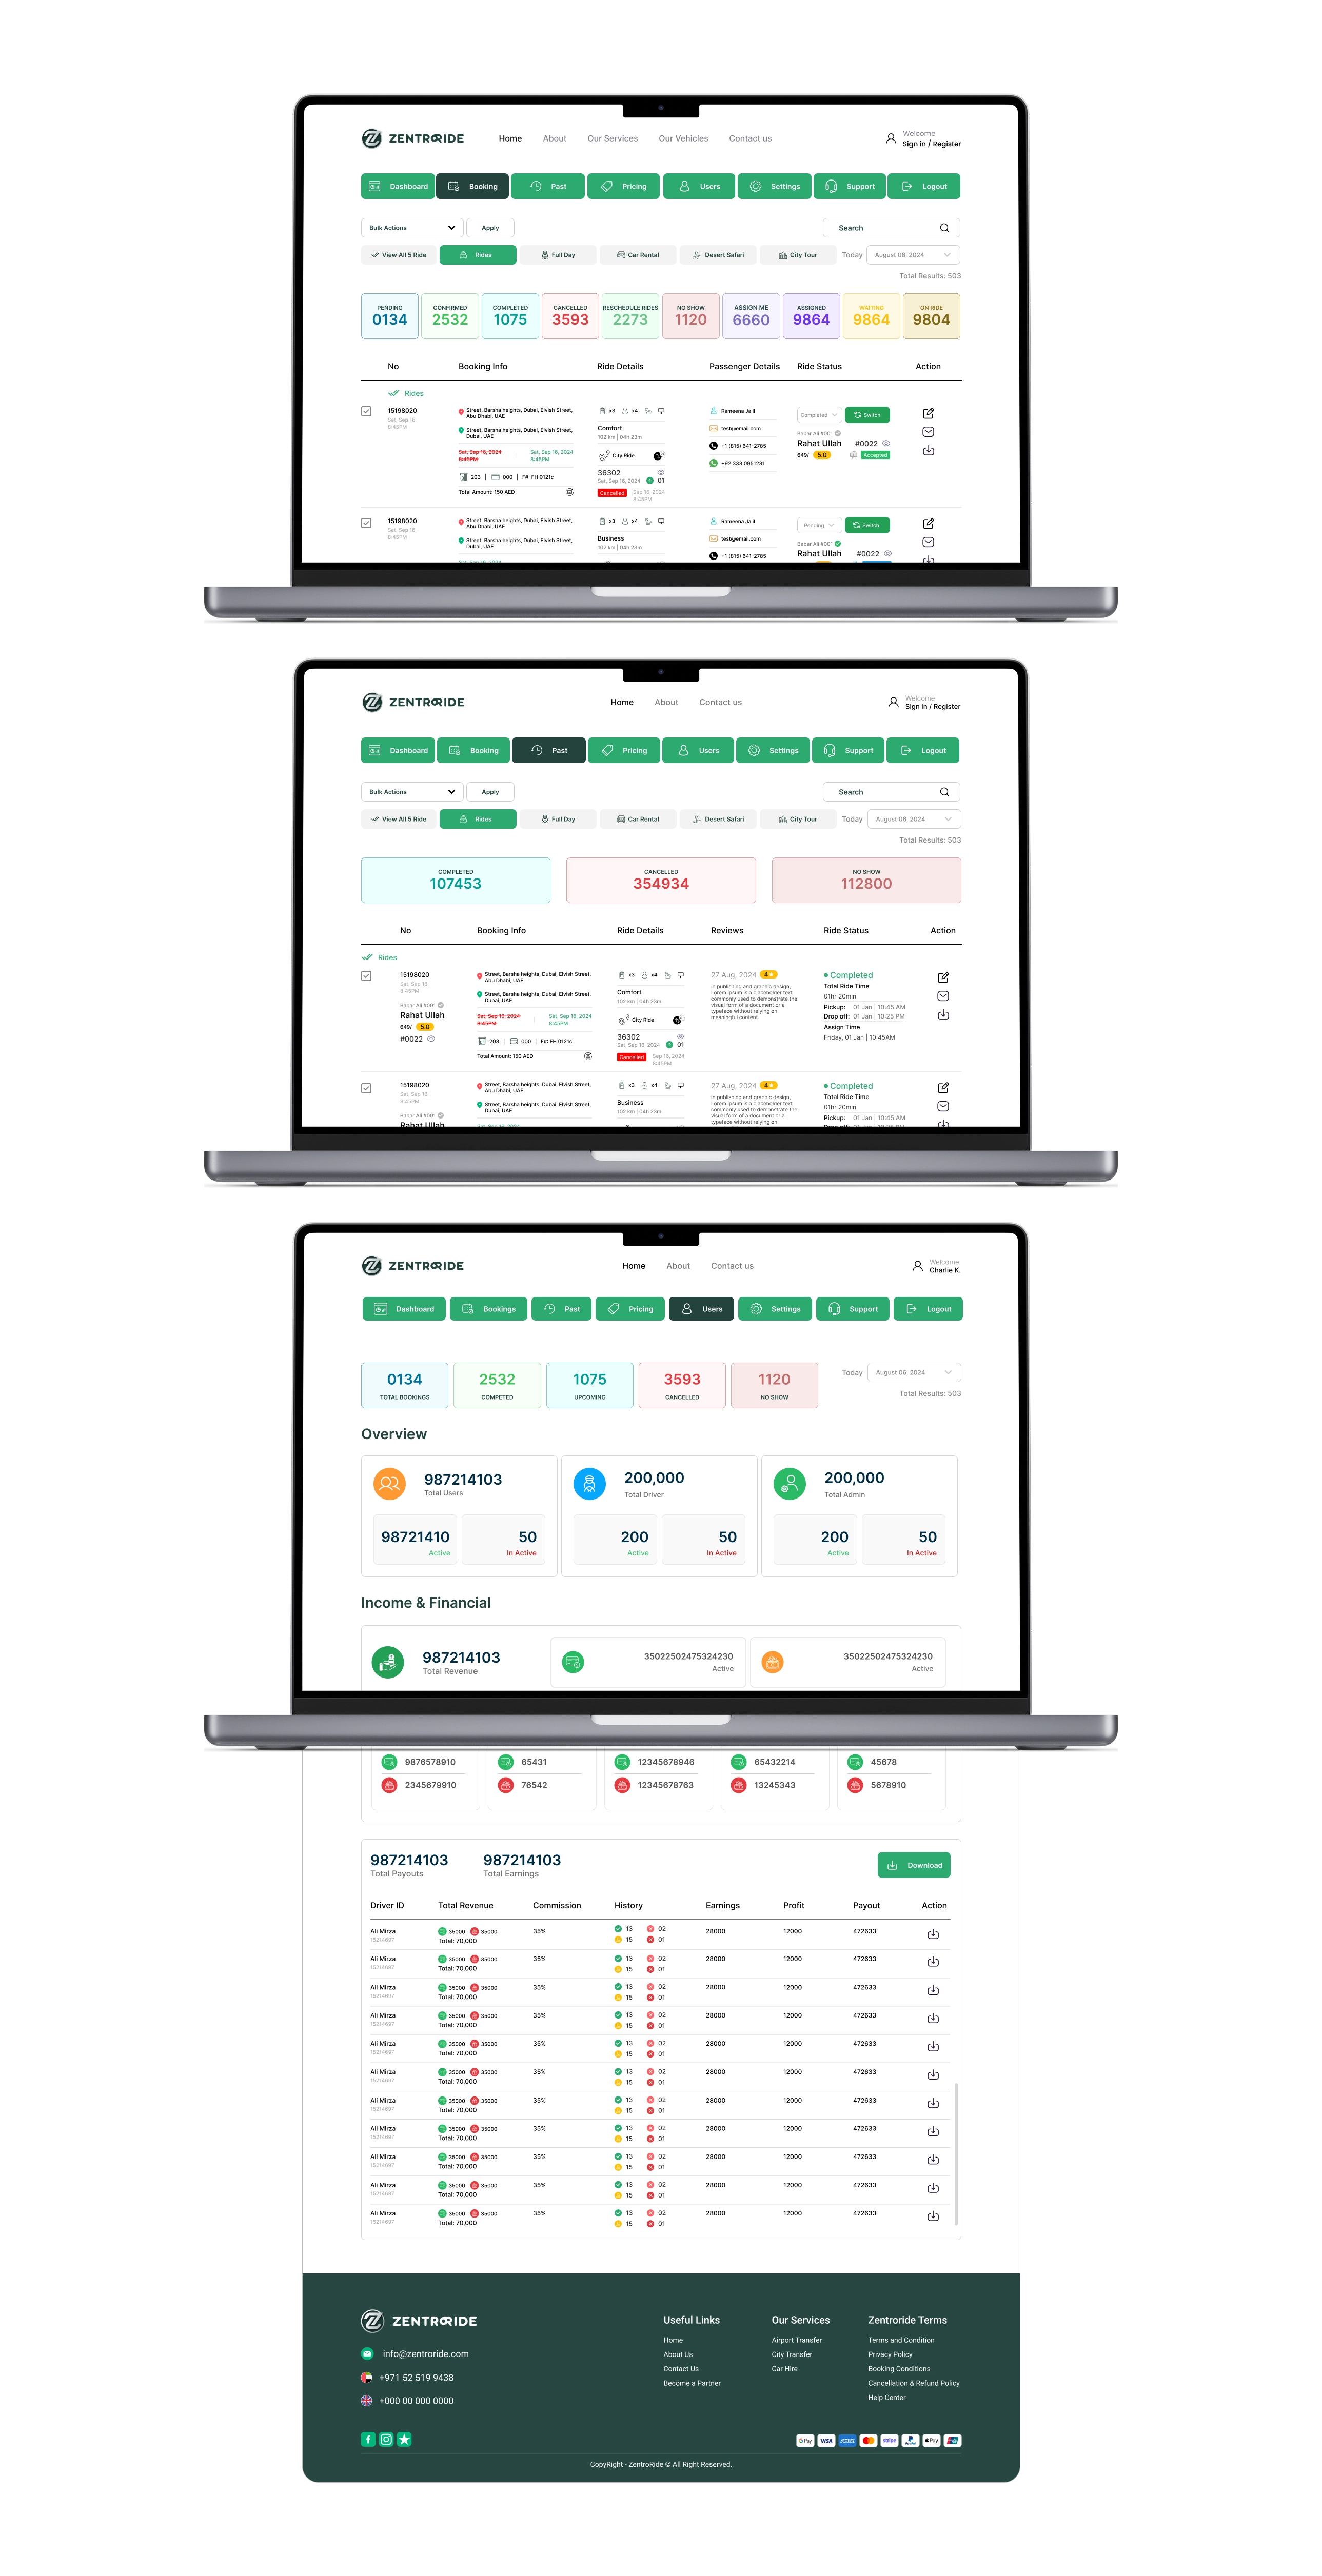
Each dashboard was shaped around the role’s main question.
Rider
What have I booked, what happens next, and can I repeat a trusted trip?
Driver
What am I assigned today, where do I need to go, and is anything blocking me?
Admin
What needs a decision today?
Design System
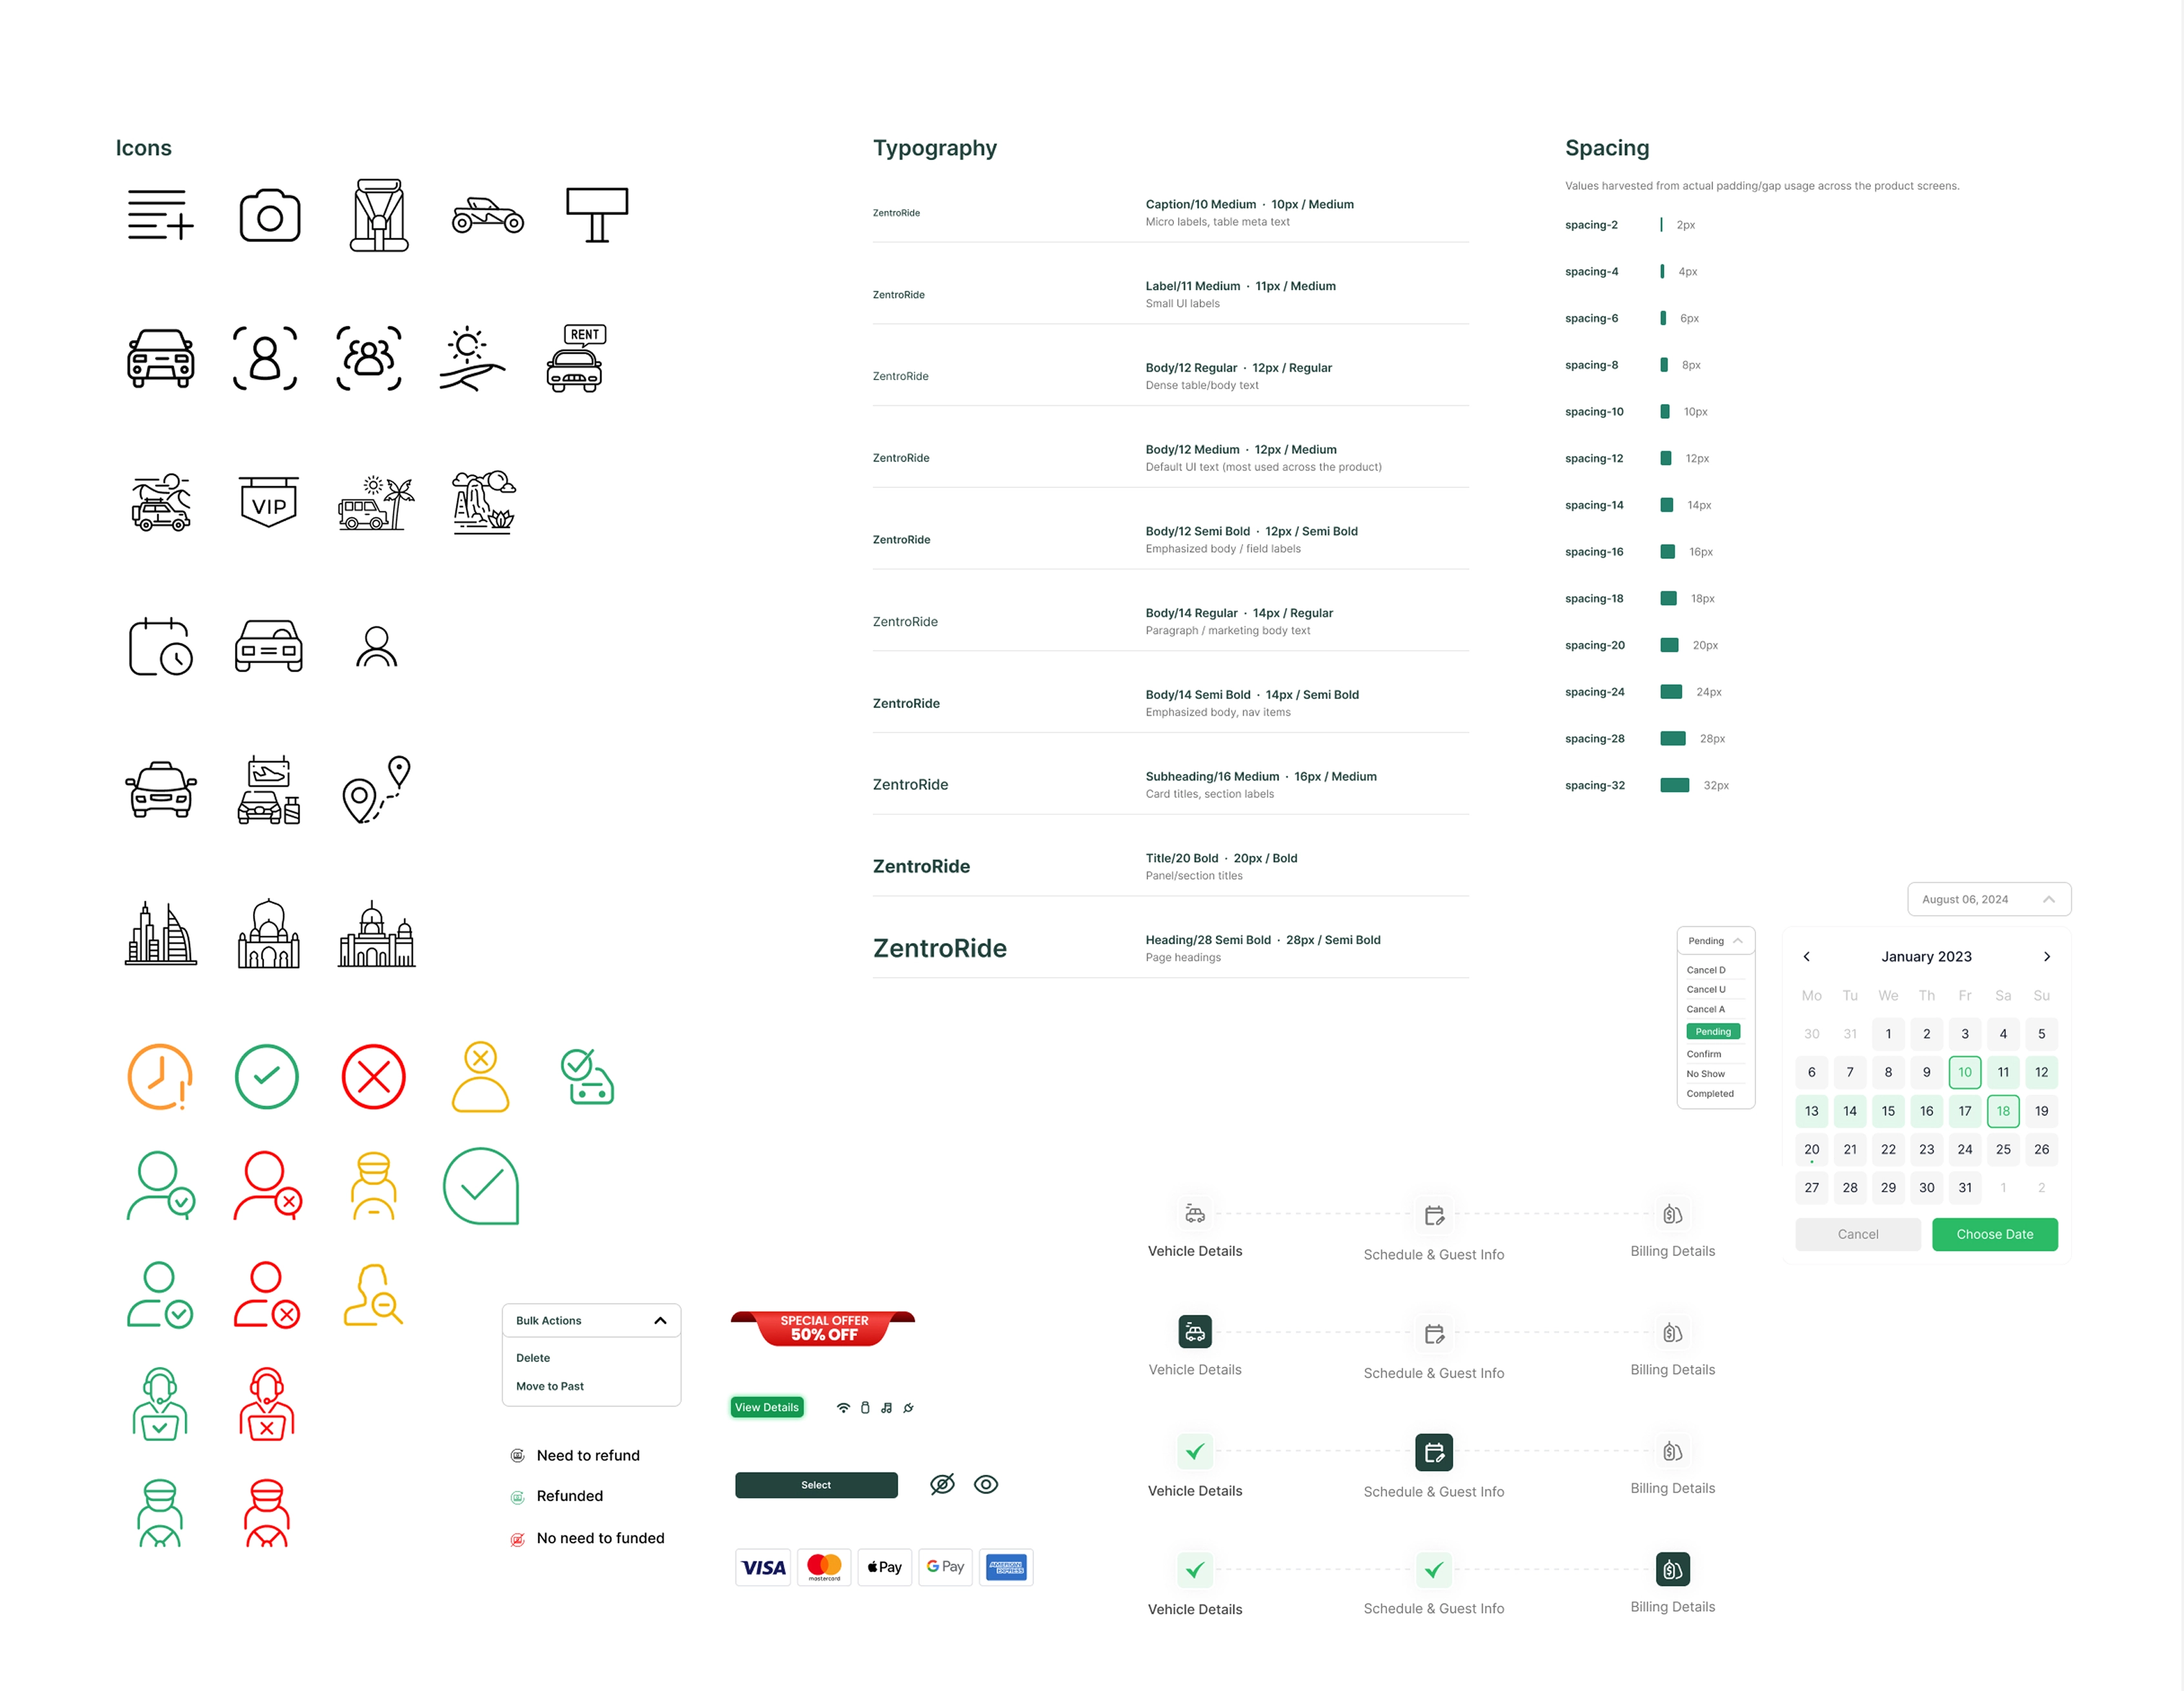
Because the product covered one public website and four dashboards, consistency had to be built into the system. I created shared patterns for typography, spacing, forms, booking cards, status badges, tables, filters, empty states, and dashboard layouts. Role-specific needs were handled through variants, so each surface could feel specific without becoming visually disconnected.
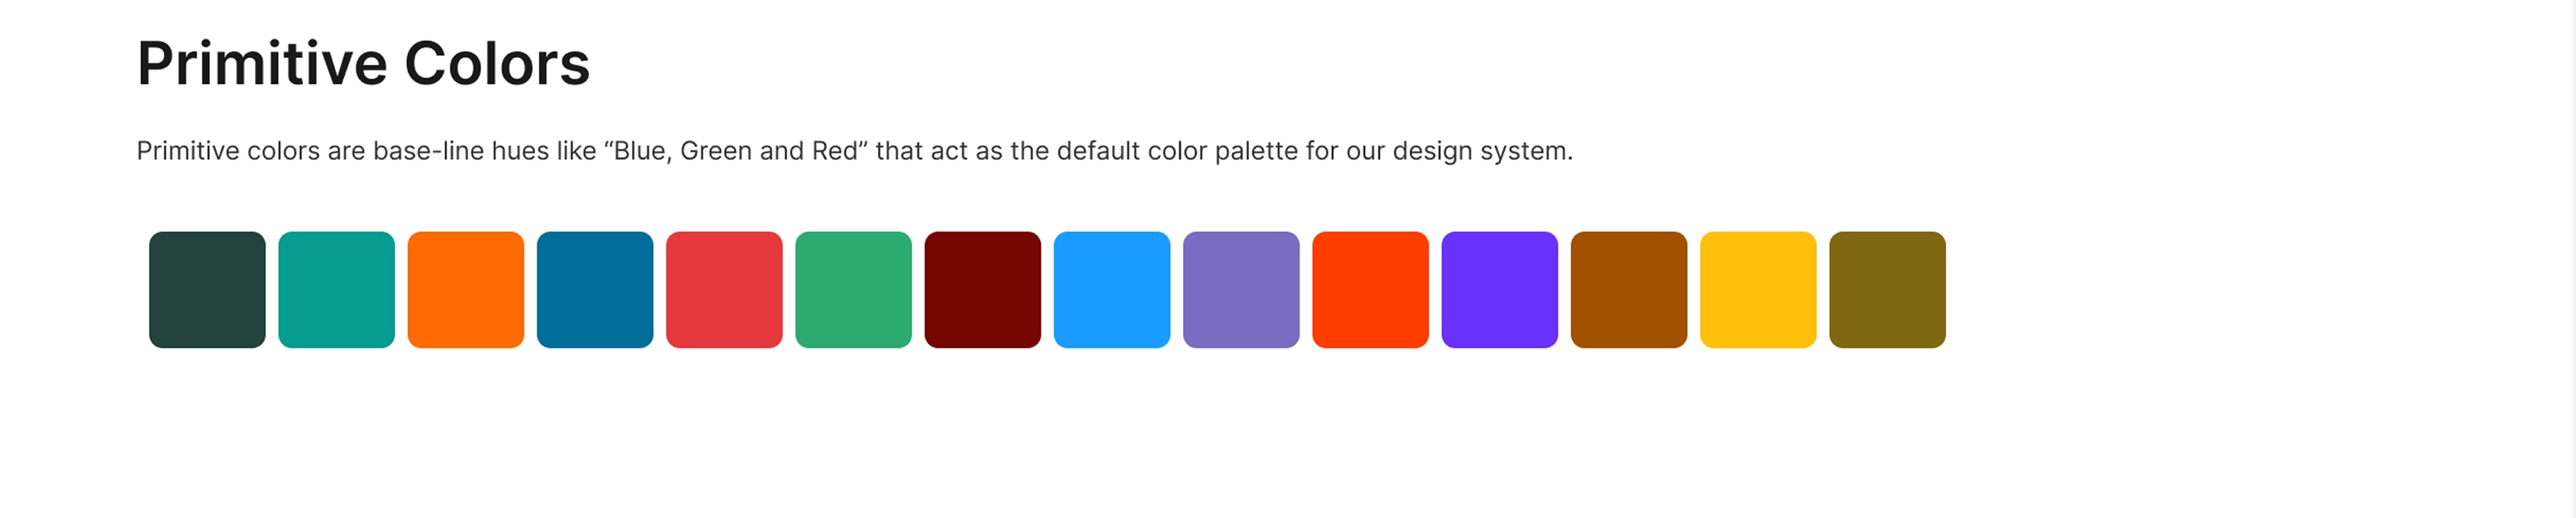
Primitive Colors
Primitive colors are base-line hues like “Blue, Green and Red” that act as the default color palette for our design system.
Color Scale
We create a 9 step tint and shade scale for the base colors. Tints are created by increasing the lightness value of the base color, and shades are created by decreasing it.

QA, Edge Cases & Constraints
I also ran QA across the website and dashboards to check component consistency, empty states, responsive behavior, and data issues. Some rider-dashboard enhancements, like deeper trip-history filtering and referral flows, were left for a later phase. Admin and partner workflows came first because failures there affected the whole operation downstream.
Outcome
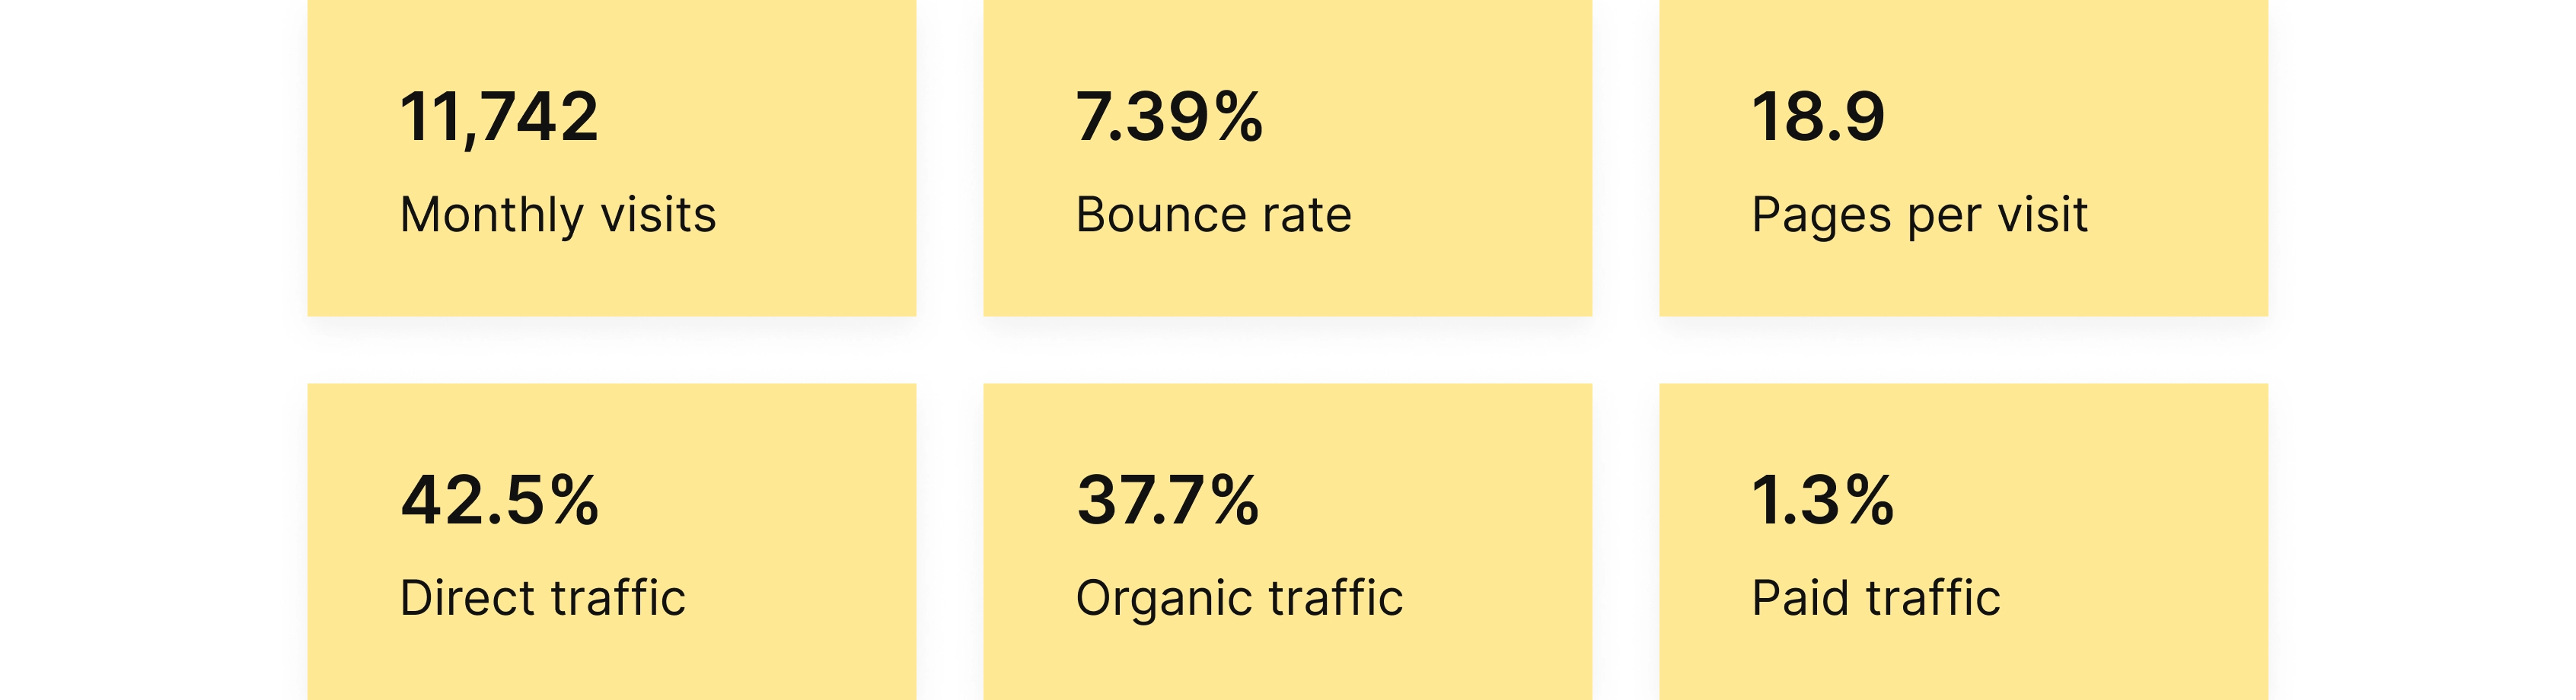
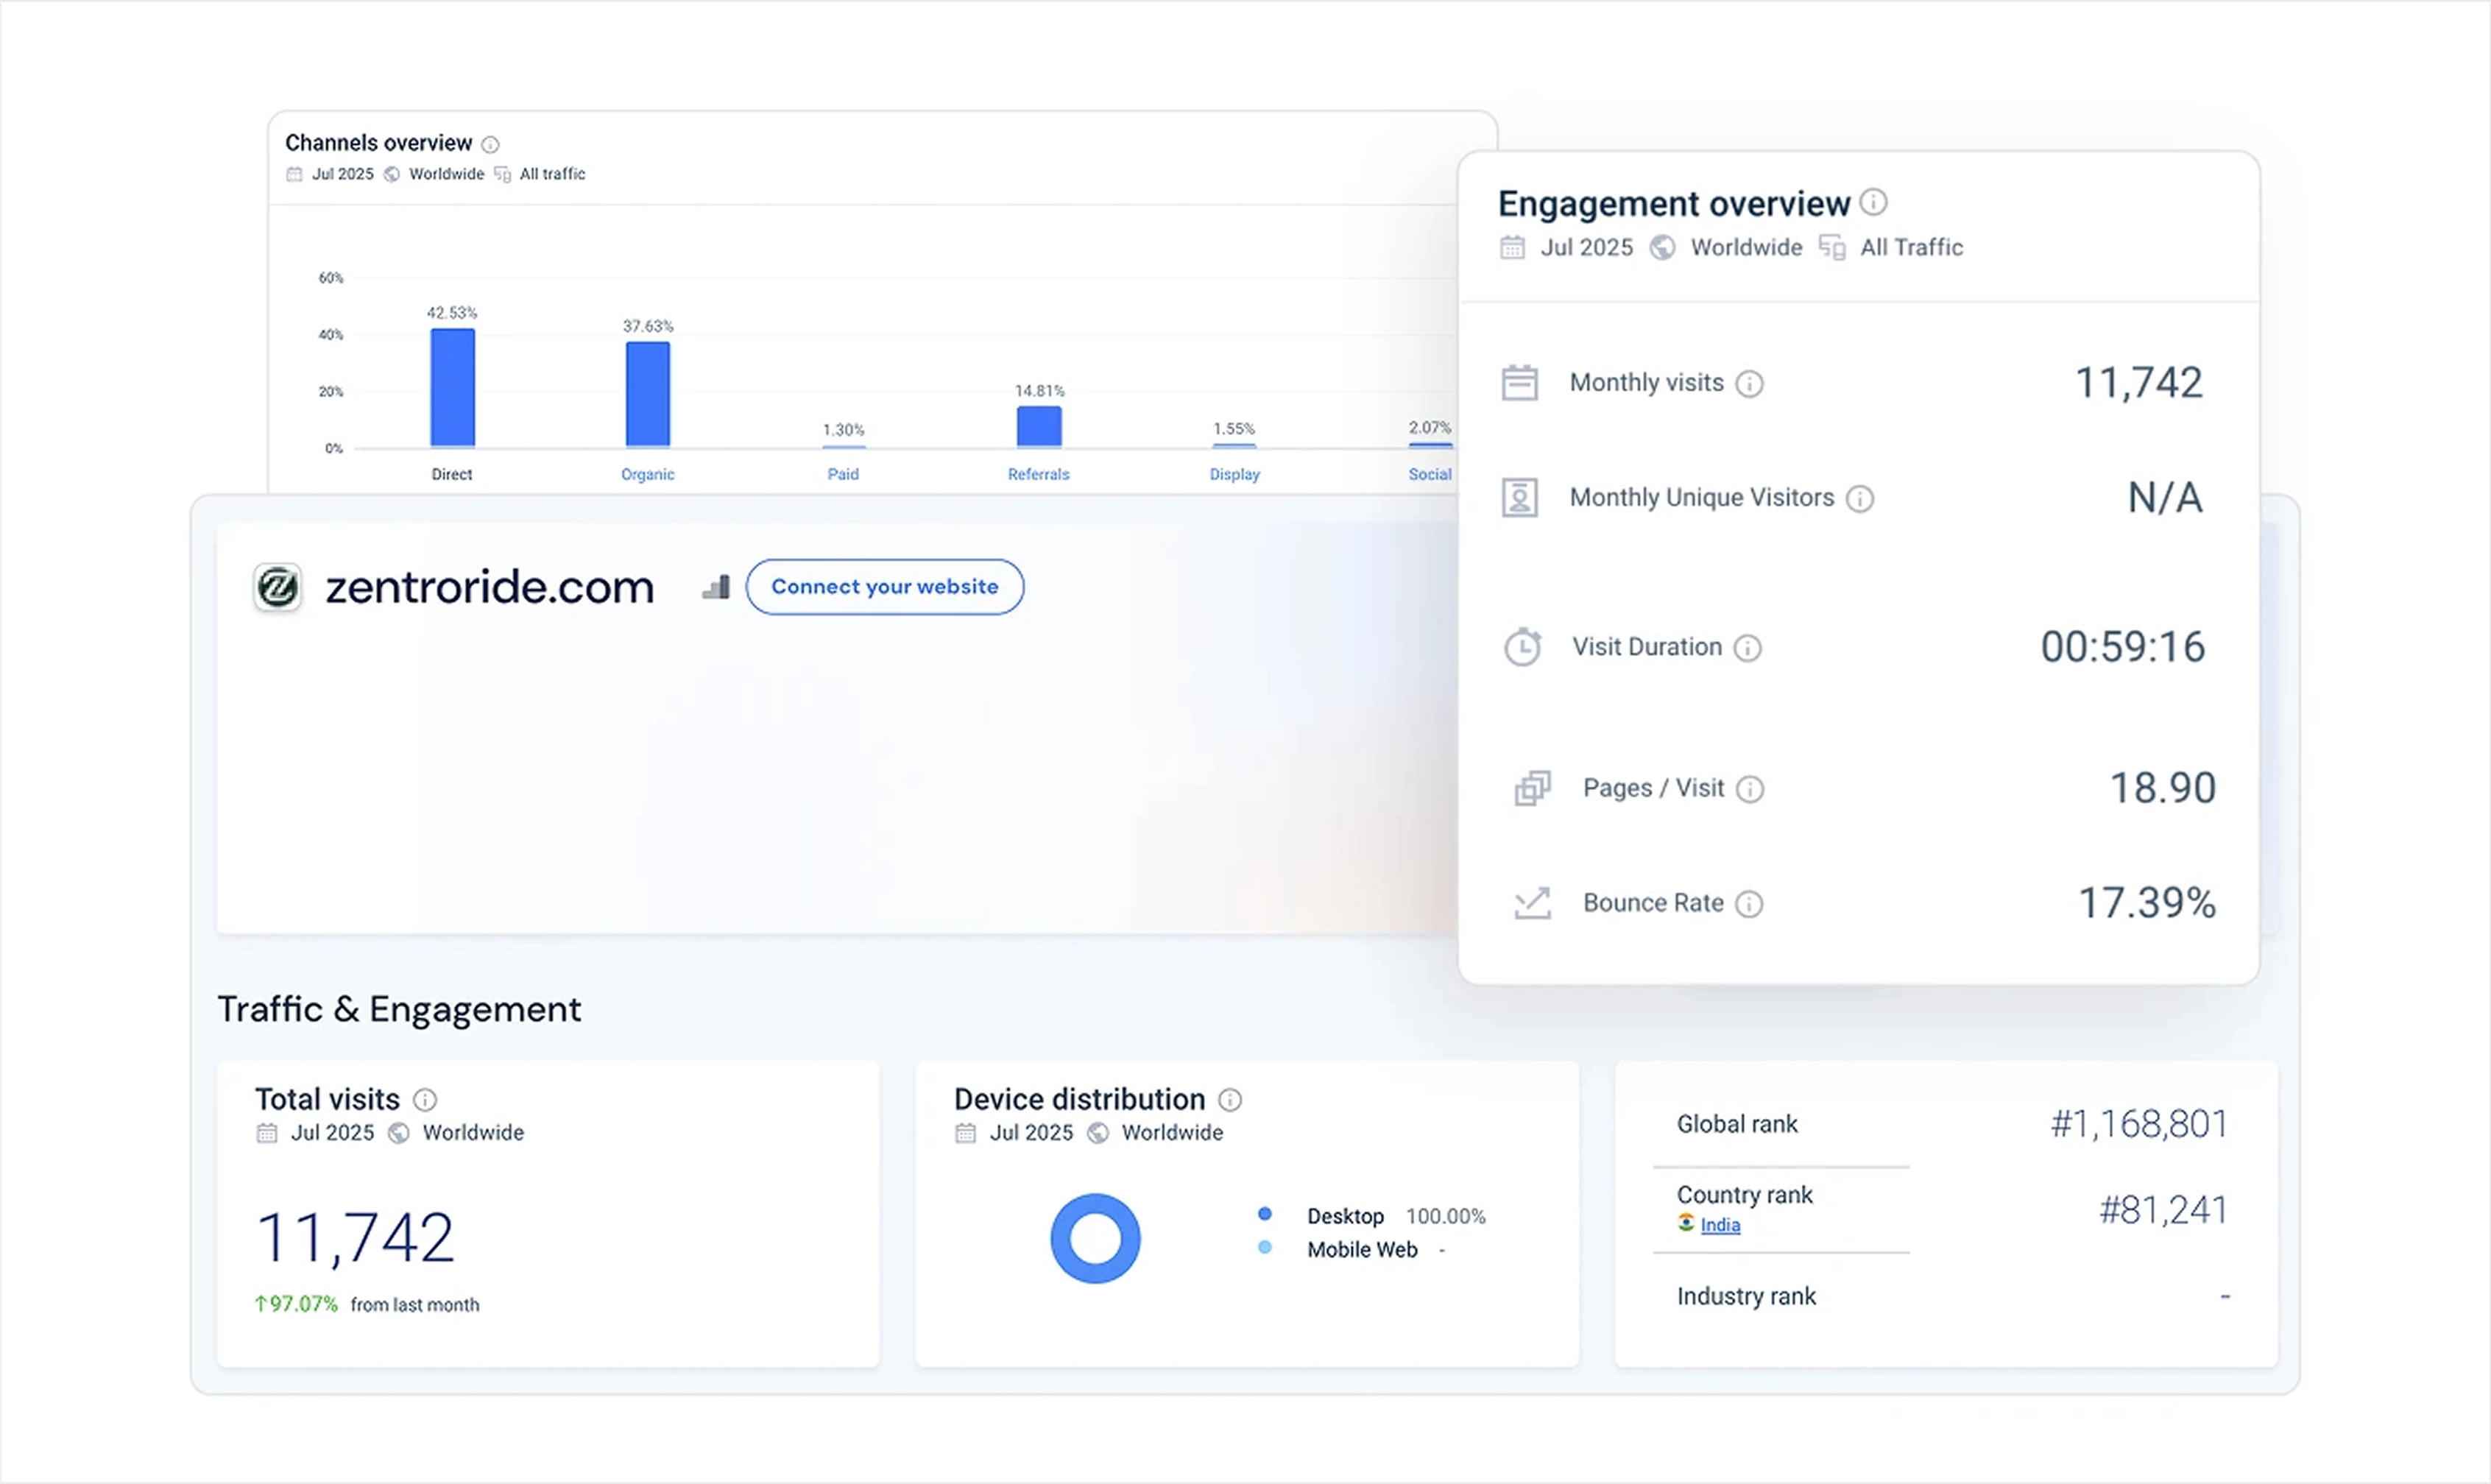
As of July 2025, ZentroRide recorded:
The behavior suggests people were moving deeper into the product: comparing services, checking vehicle options, reading service rules, and returning with intent.
- 11,742 — Monthly visits
- 7.39% — Bounce rate
- 18.9 — Pages per visit
- 42.5% — Direct traffic
- 37.7% — Organic traffic
- 1.3% — Paid traffic
Reflection
ZentroRide taught me how much product design sits between the visible screen and the operation behind it. The work was not only about making booking look better. It was about making price, capacity, pickup rules, driver assignment, partner eligibility, and admin decisions visible enough for the service to scale. That is the part of the project I value most: turning a manual process into a product system people could actually use, manage, and trust.