Financial intelligence platform
Finmetrx
Finmetrx brings financial reporting, cashflow, forecasting, and AI-assisted analysis into one connected product system.
Role
Product Designer
Scope
End-to-End Product Design
Focus
Product UX · AI Product Design · Information Architecture · Financial Dashboards · Data Visualization · Design System
Introduction
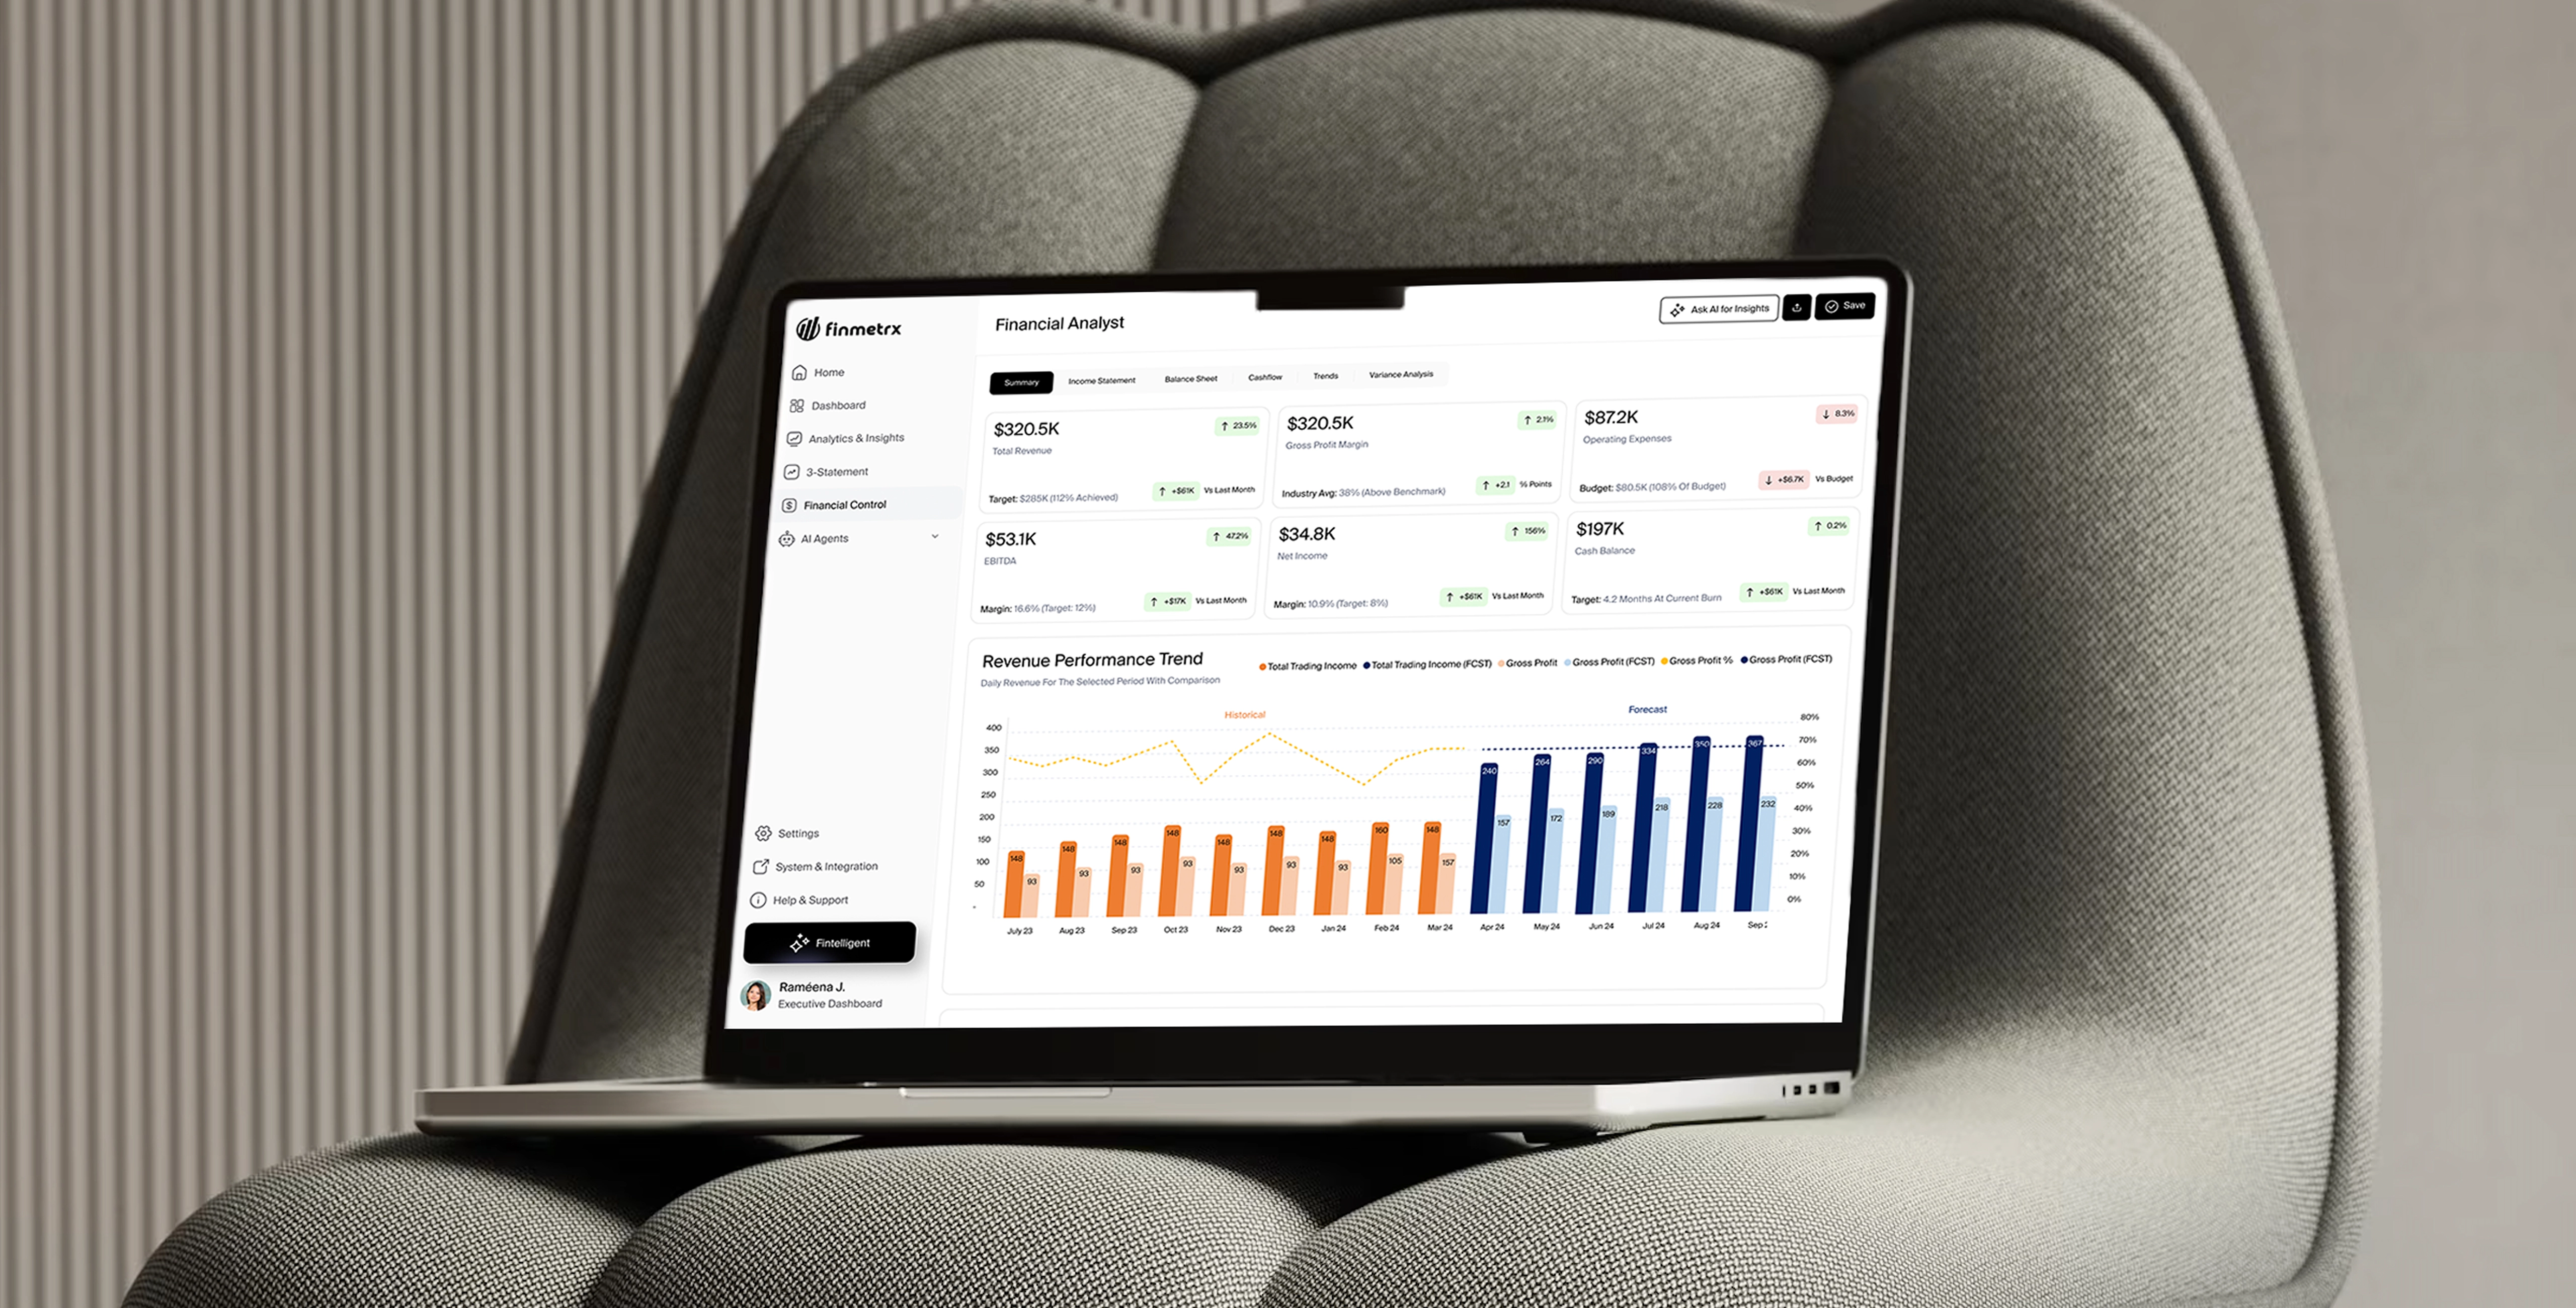
Finmetrx is a financial intelligence platform for businesses that need a clearer view of performance, cashflow, and risk.
It brings financial workflows, connected data, and specialized AI agents into the same product, so users can move from raw numbers to structured dashboards, analysis, and follow-up questions in one place.
Problem
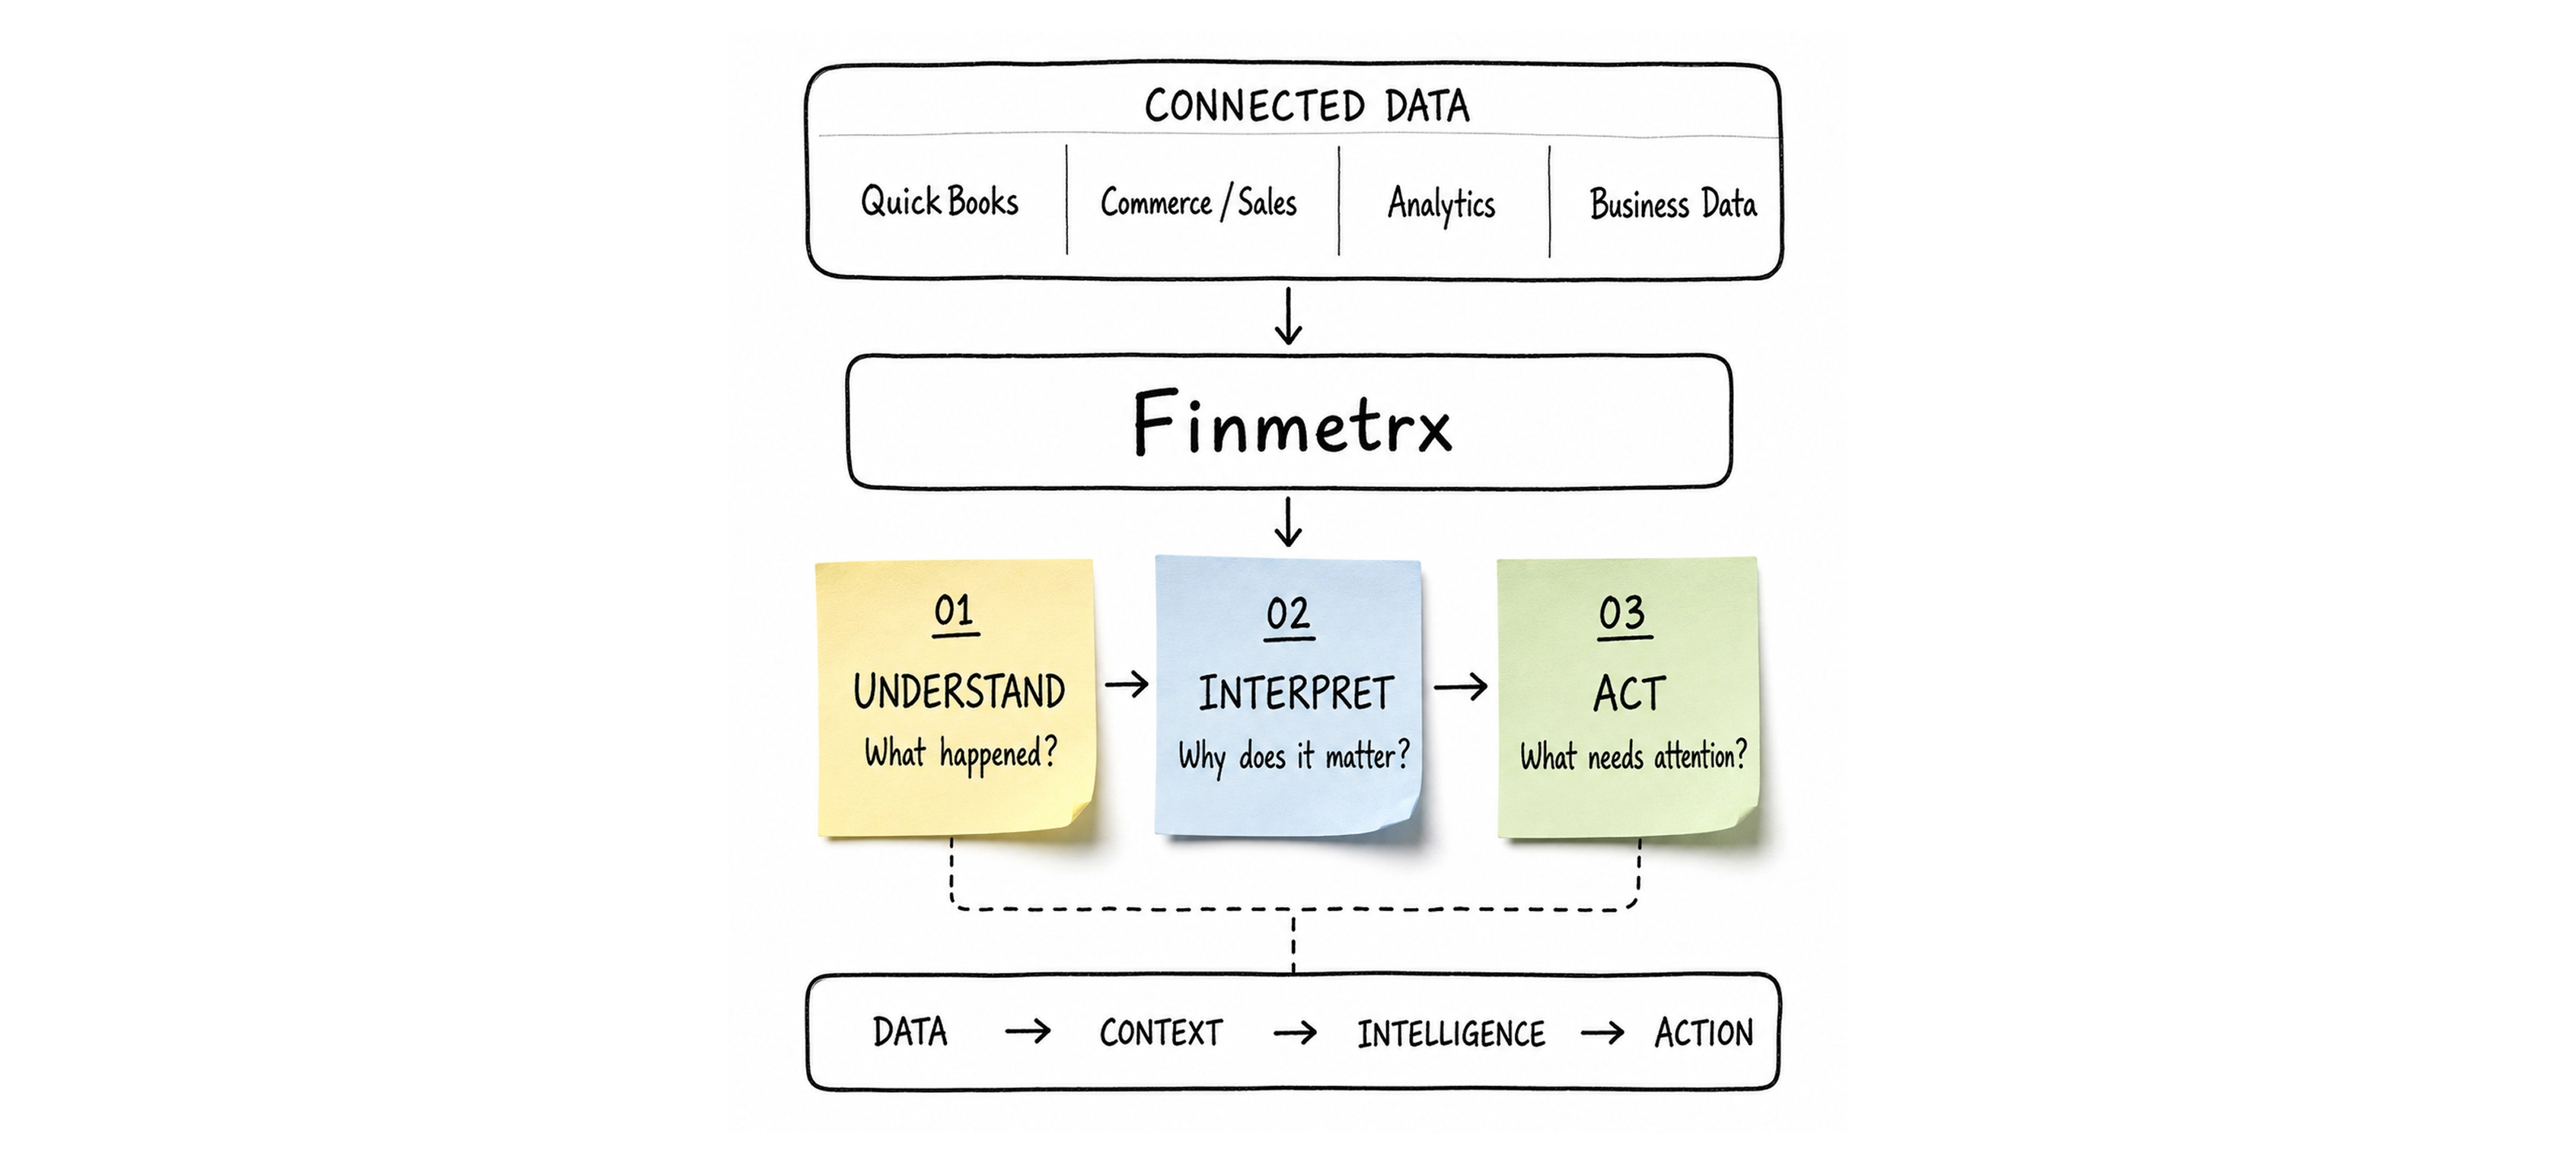
Finmetrx already had the financial data and early dashboard direction, but the experience was still hard to understand.
A lot of the information lived in spreadsheets, dense tables, and disconnected views. Users could see numbers, but it was not always clear what had changed, why it mattered, or what needed attention first.
The problem was not only visual clutter. The product needed a clearer structure for how financial data became insight: what users should see first, what details could come later, and how AI could support the work without making the system feel more complex.
Who It Is For
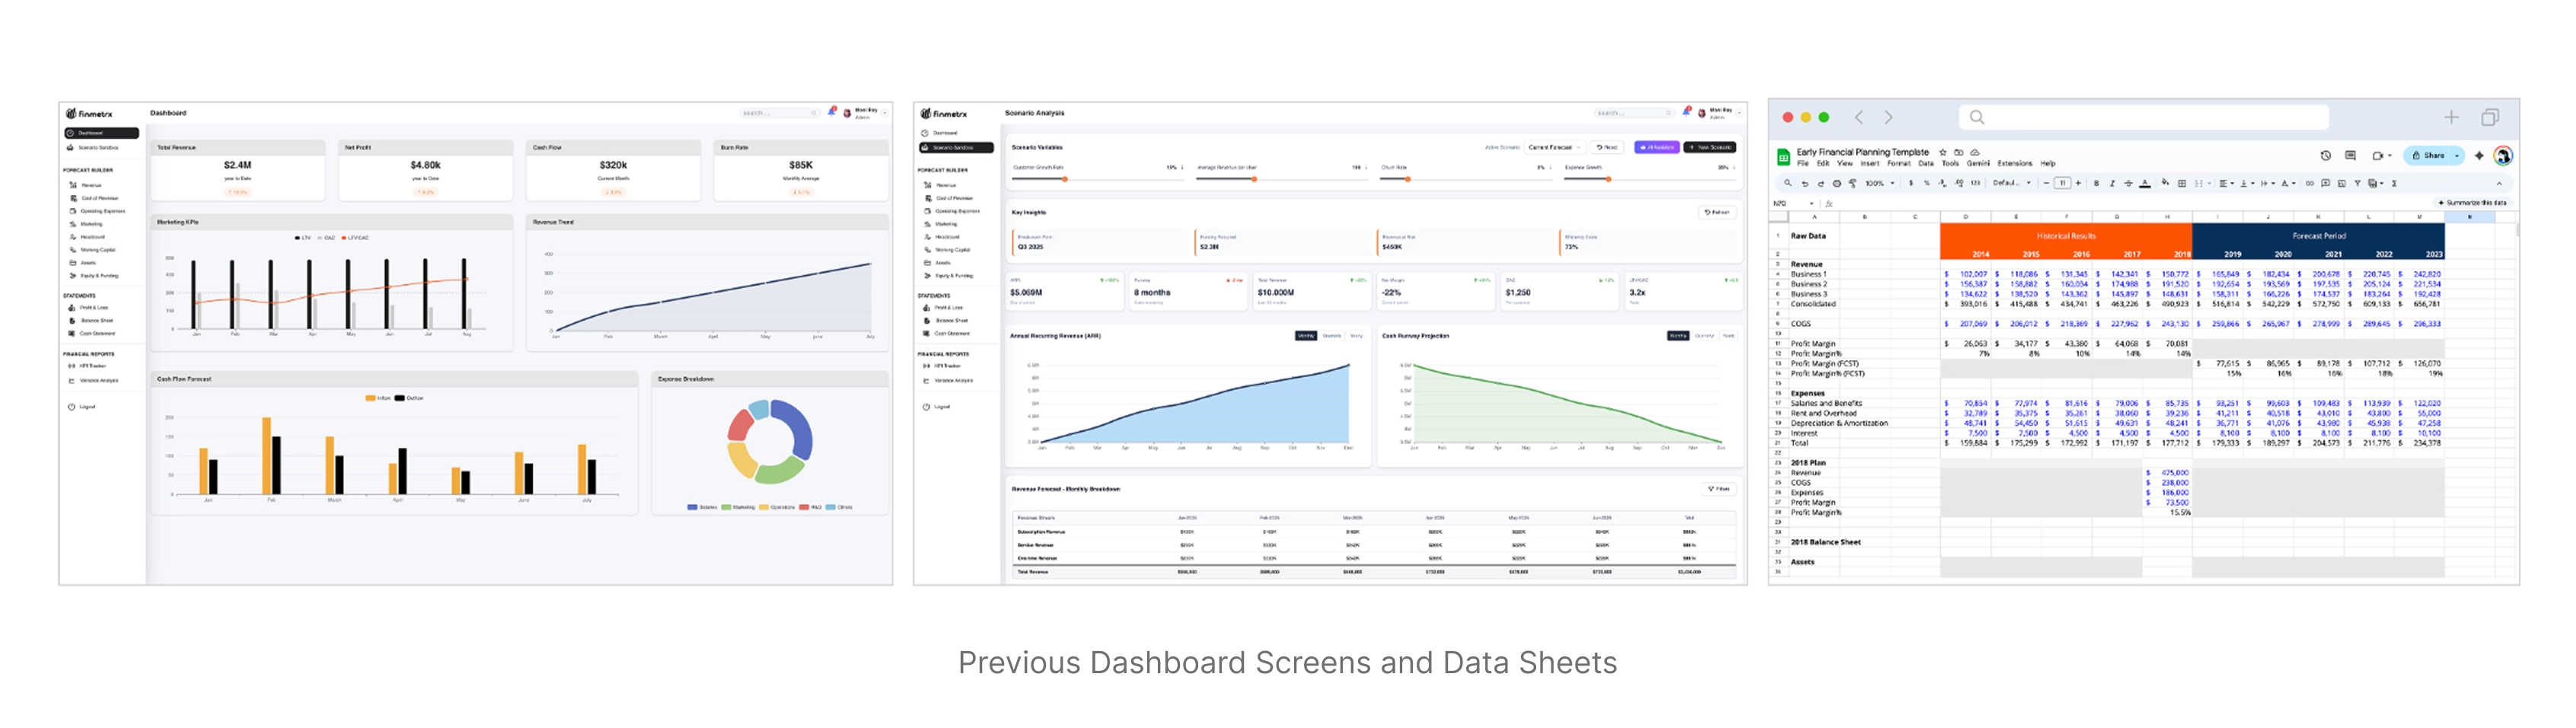
Finmetrx is designed for business teams that need to understand financial performance without jumping between spreadsheets, dashboards, and disconnected tools.
The main users include founders, finance leads, operators, and business stakeholders who need visibility into cashflow, revenue, risk, and overall business health.
They are not only looking for reports. They need to understand what is happening, why it matters, and where their attention should go next.

My Role
I led the product design work across the core Finmetrx experience, covering financial UX, AI product flows, dashboards, data visualization, information architecture, prototyping, and design system patterns.
I was responsible for shaping financial reporting, cashflow, integrations, specialized AI agents, and conversational intelligence into a connected product experience.
I worked closely with the client, stakeholders, and developers to turn business and product requirements into interface decisions, user flows, and reusable patterns.
Finmetrx is a real client engagement, and the product is currently in active development.
The Product System
Finmetrx had several connected parts: financial reporting, cashflow, integrations, specialized AI agents, and conversational intelligence. The challenge was making those capabilities feel like one product instead of separate tools placed inside the same interface.
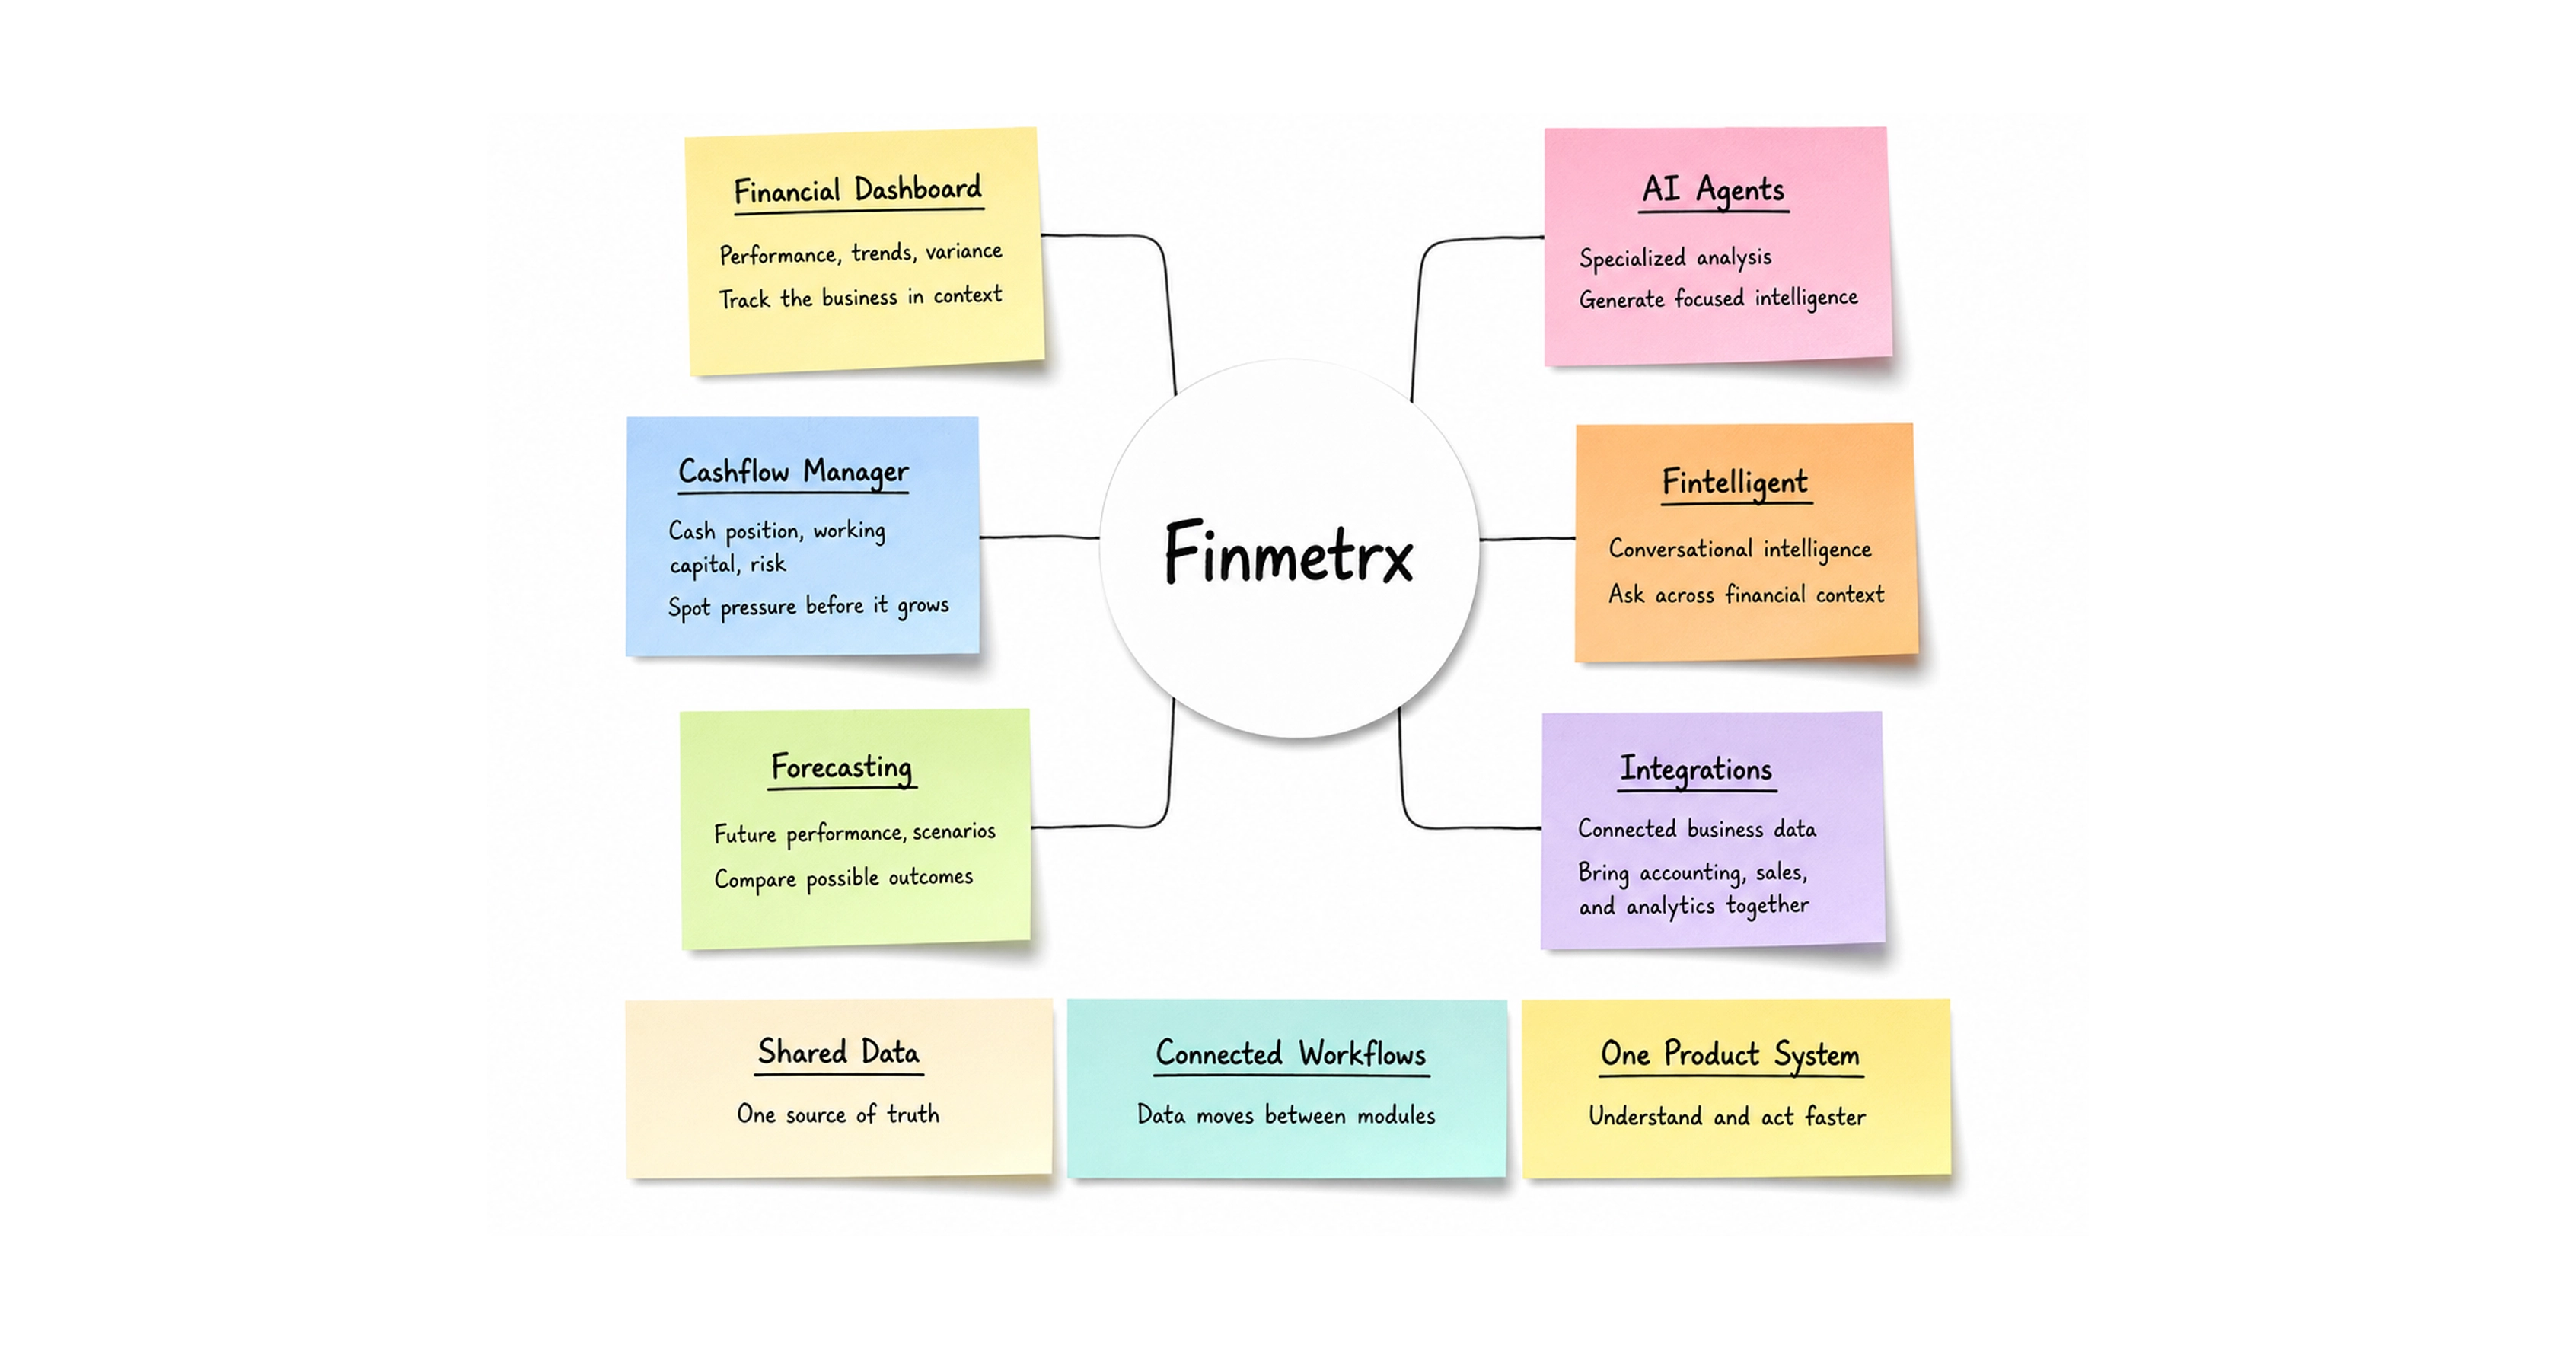
I structured the experience so the core financial workflows could stand on their own, while AI supported the places where users needed help understanding, investigating, or acting on the data.
Process
The design direction came from competitive research, client conversations, and a close review loop with the product and development team.
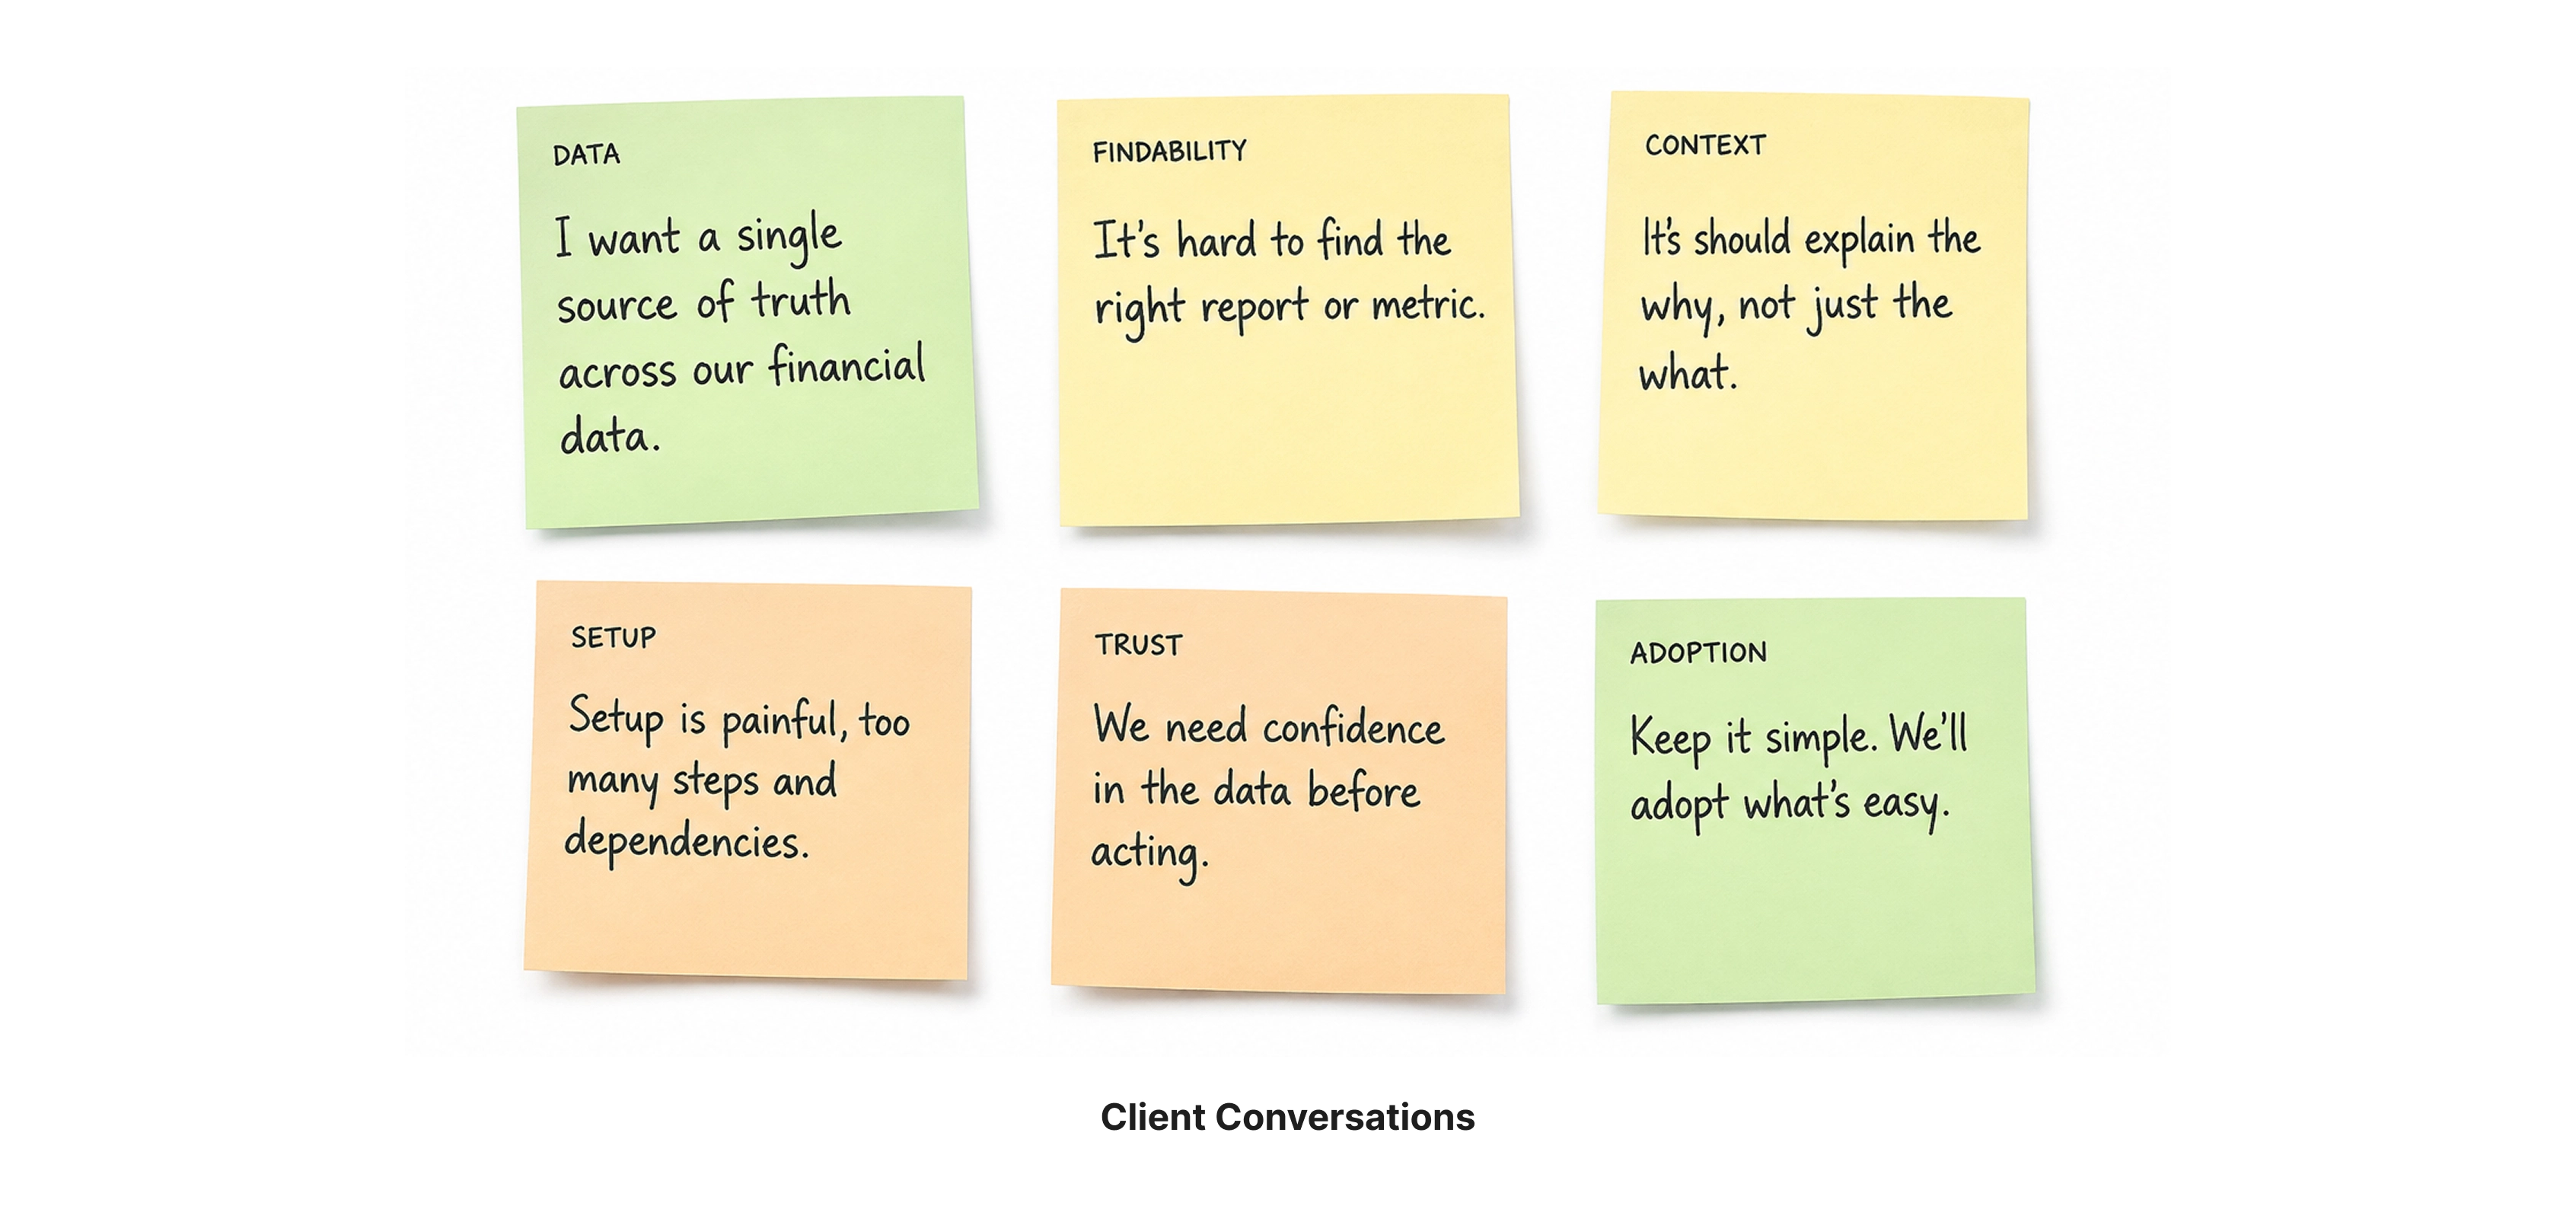
Early conversations surfaced core needs, pain points, and mental models that informed our priorities.
Client Conversations
I reviewed products like Triple Whale, LiveFlow, Abacum, and Runway to understand how mature financial and analytics platforms handled reporting, dashboard hierarchy, connected data, and AI-assisted analysis.
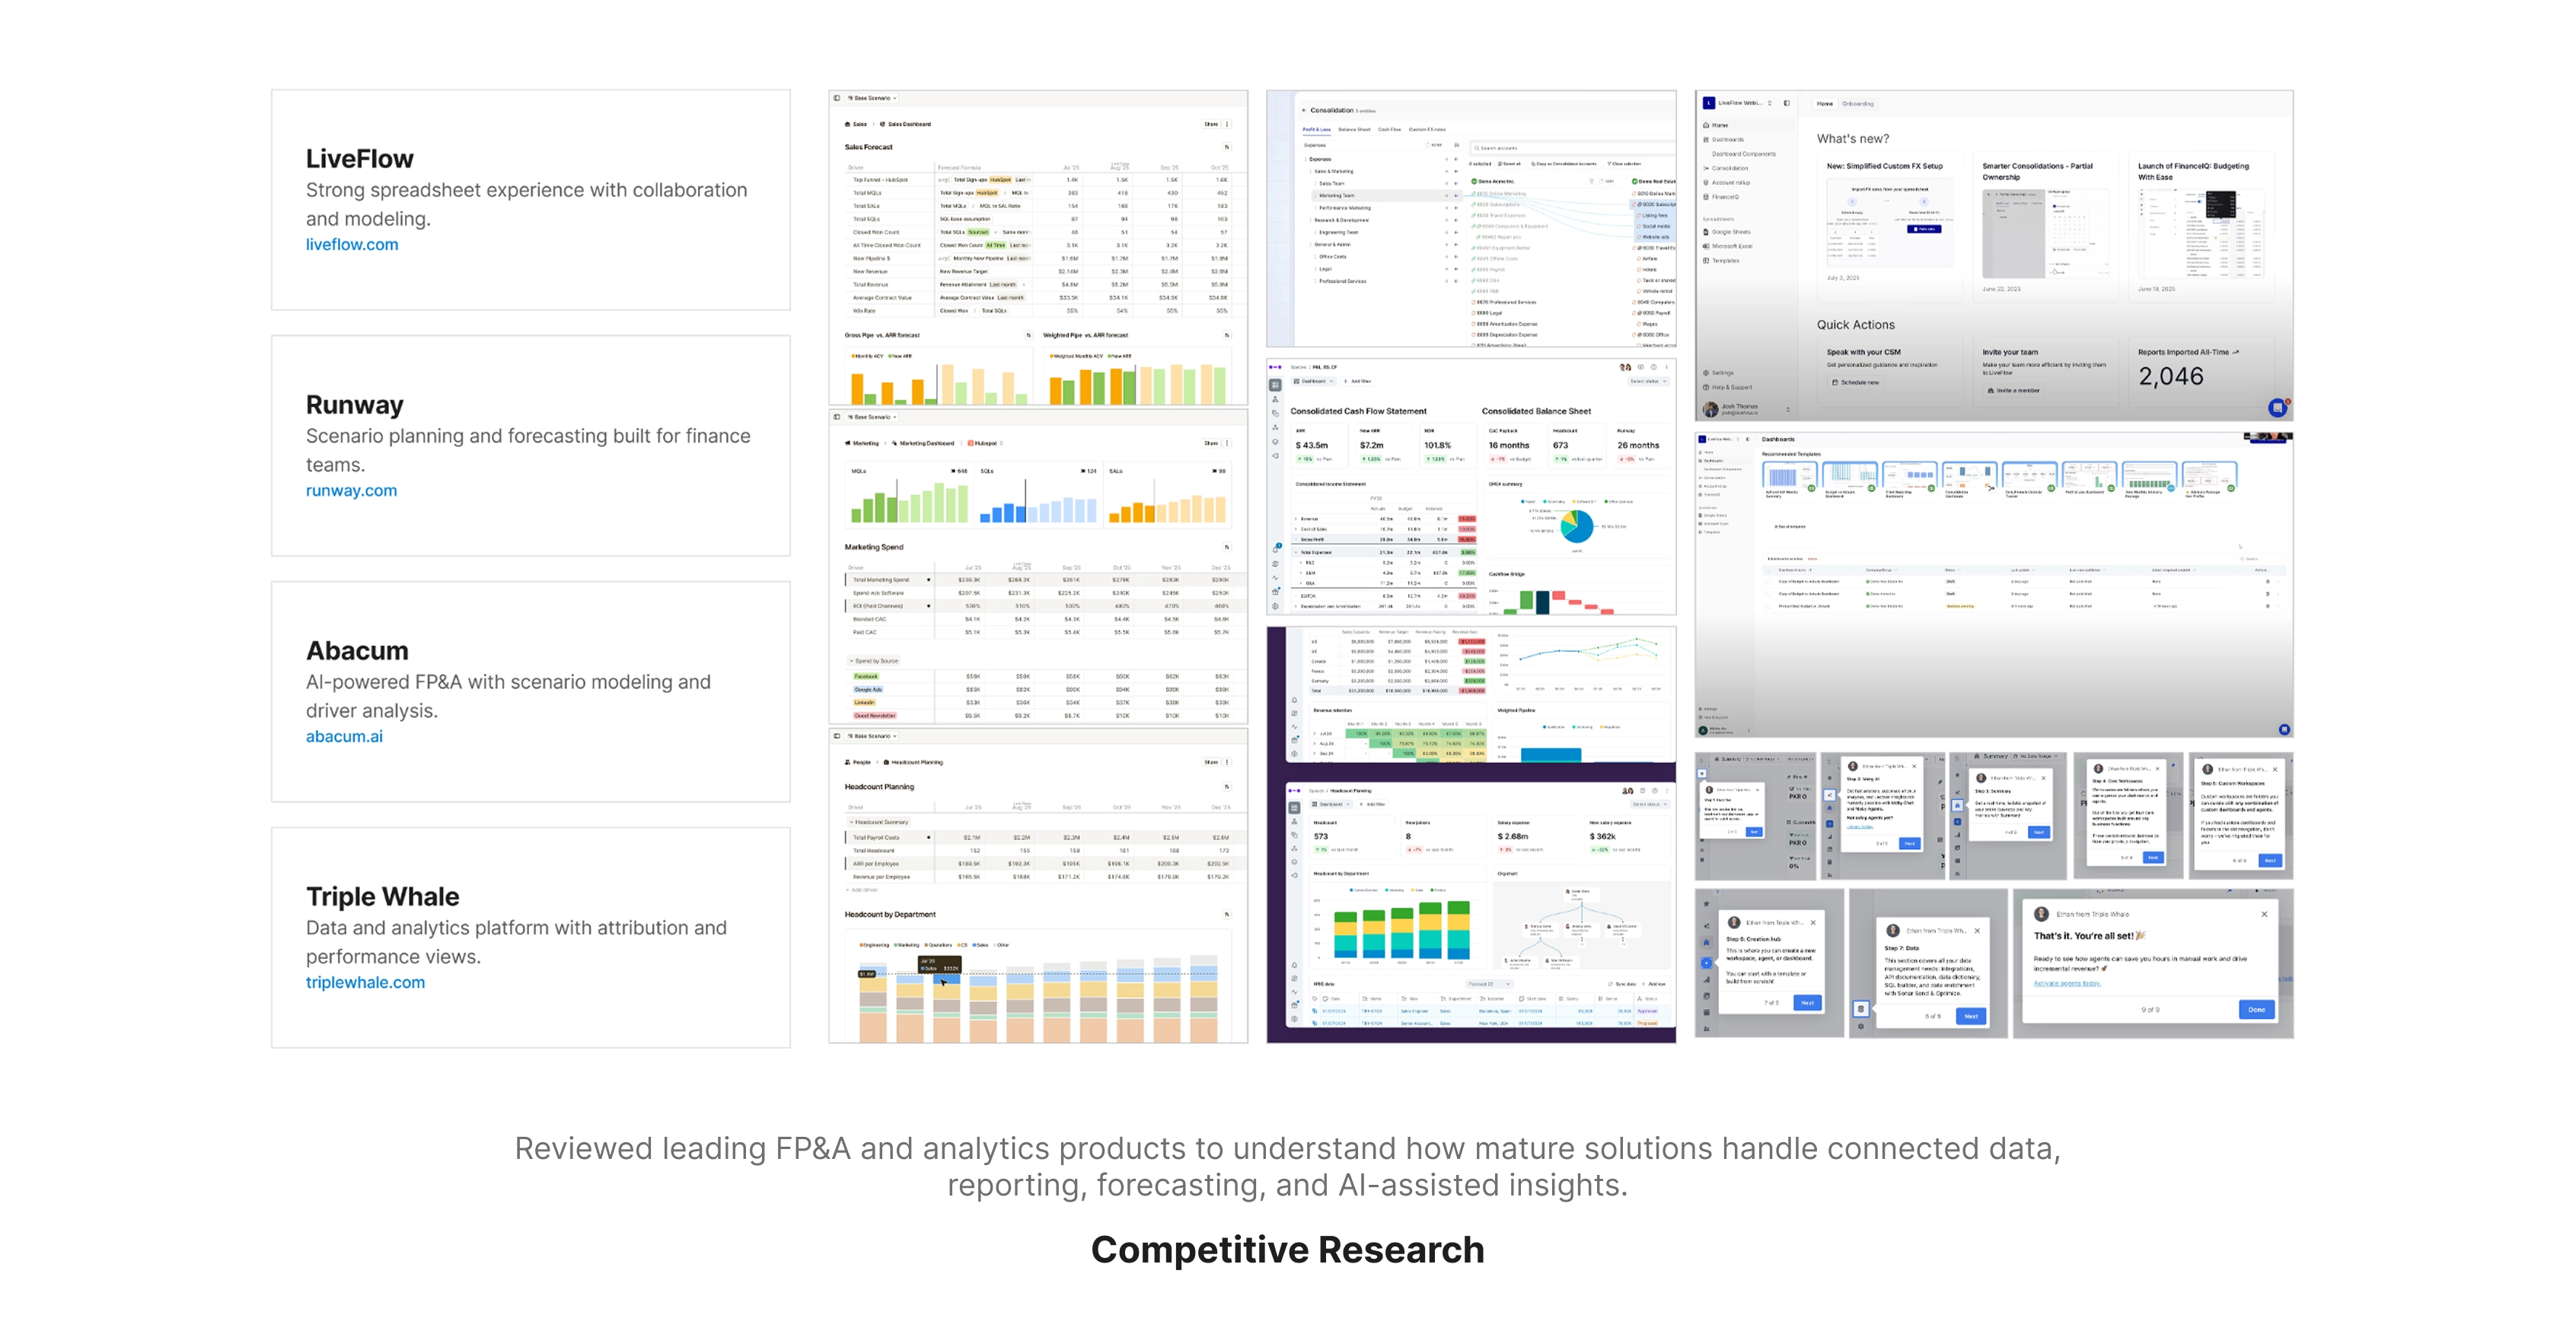
Reviewed leading FP&A and analytics products to understand how mature solutions handle connected data, reporting, forecasting, and AI-assisted insights.
Competitive Research
From there, I mapped the main workflow structure: how data comes in, how it becomes ready, how users review insights, and where action or follow-up should happen.
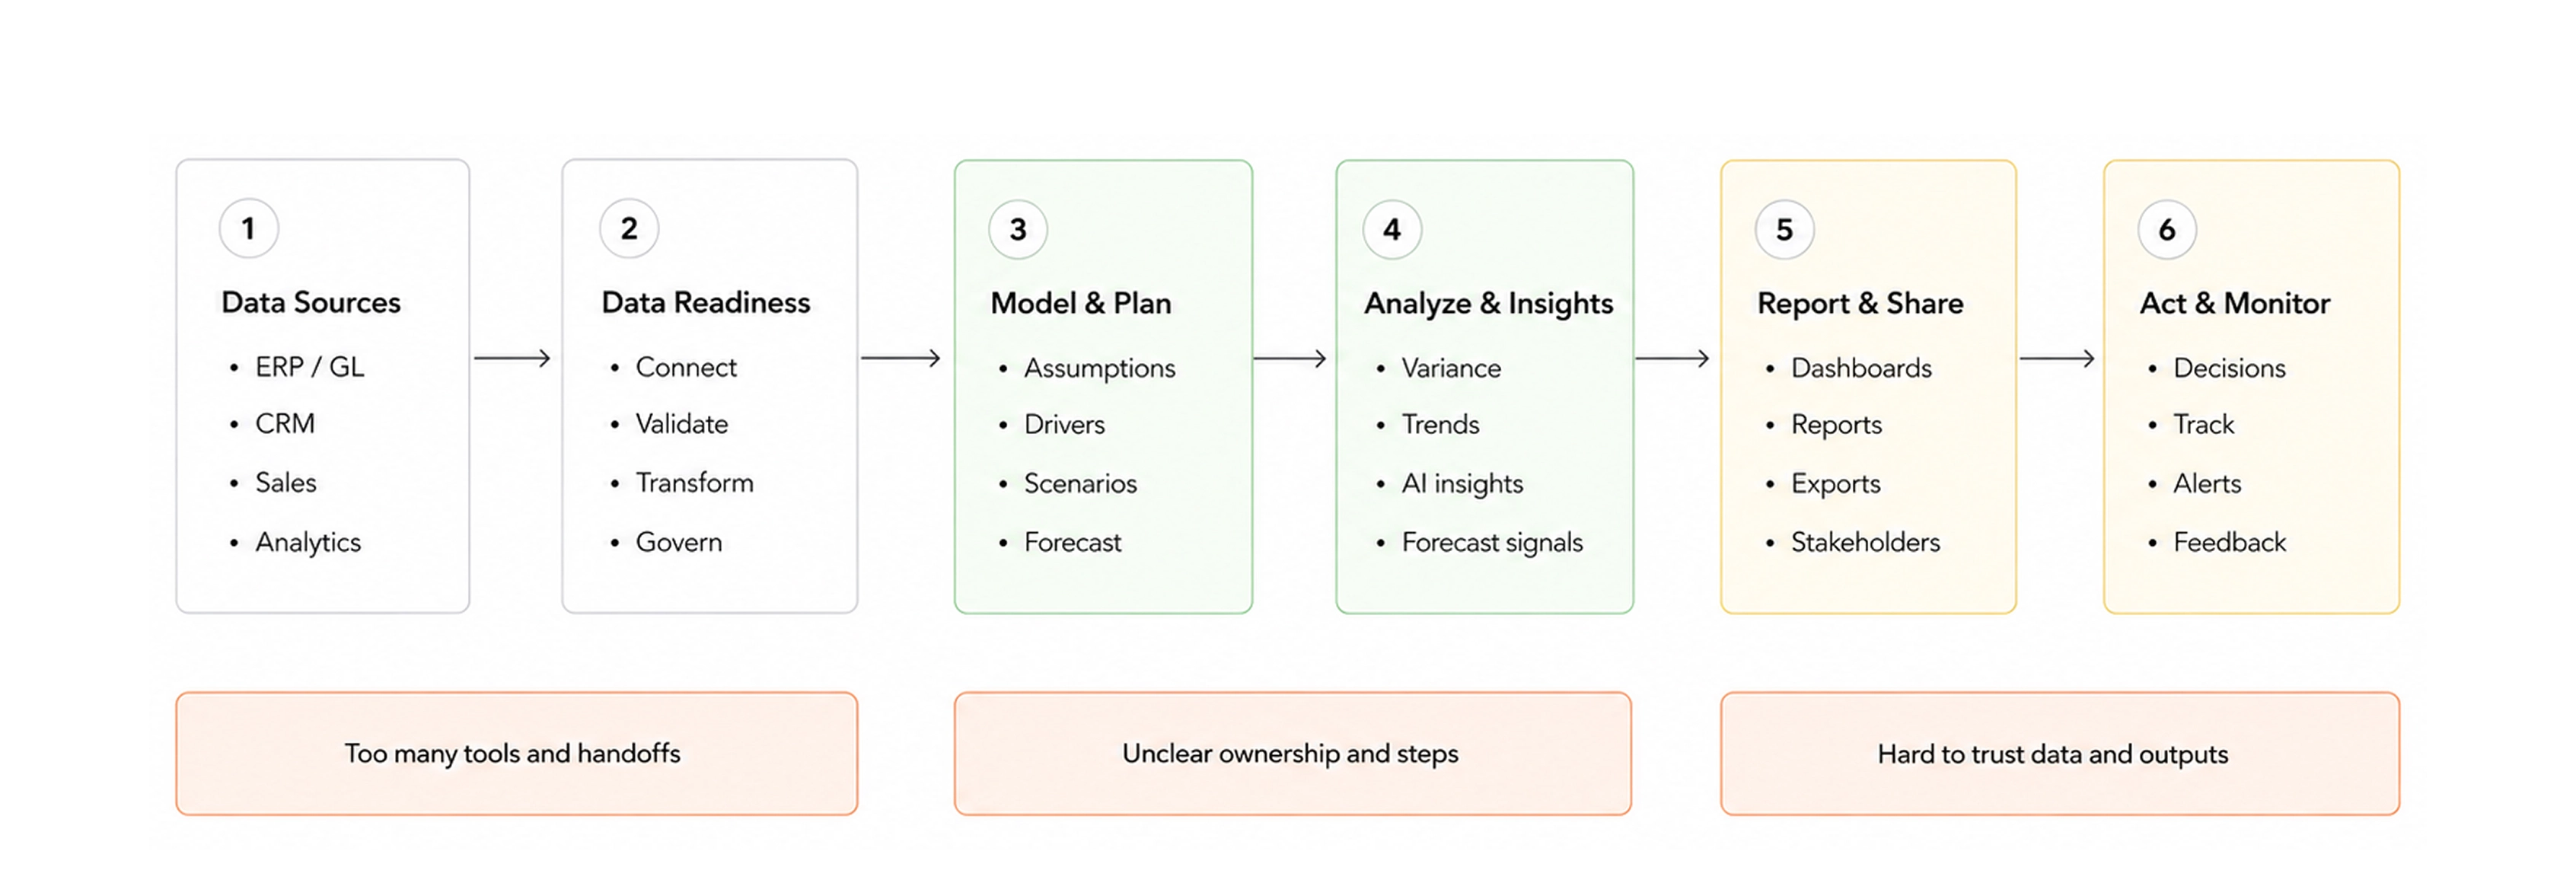
Mapped end-to-end workflows to reflect business logic and reveal where complexity and handoffs created friction.
Workflow Structure
That process helped define what information should come first, where complexity needed to be reduced, and where AI could support the workflow without taking control away from the user.
User Flows & IA
Finmetrx had several workflows that were closely connected, but easy to make confusing if they were designed in isolation.
I mapped the main paths across financial reporting, cashflow, integrations, AI agents, and conversational intelligence to understand where users entered, where they needed context, and how one workflow should lead into another.
That helped define the product structure before the detailed screens were refined: what belonged in each area, what needed to stay connected, and where the experience needed clearer handoffs.
I structured the experience so the core financial workflows could stand on their own, while AI supported the places where users needed help understanding, investigating, or acting on the data.
Designing the Intelligence Layer
Different business questions need different kinds of support.
Instead of one assistant trying to cover everything, I structured the AI experience around specialized agents with clear areas of responsibility.
Each agent helps users work with a specific area of the business, like sales, cashflow, financial analysis, or operational signals.
The goal was to make AI feel closer to the workflow, not like a separate feature outside the product.
Design Decision 01: Choosing the Right Agent
The agent library needed to help users compare capabilities before setup.
I grouped agents by responsibility, so users could quickly understand whether they were looking at analysts, specialists, managers, or executive-level agents.
Each card showed the agent’s role, setup time, data requirements, and activation entry point. This made the choice feel more practical: users could see what the agent could help with, what it needed, and how much setup was involved.
The goal was to make selection clear before users committed to activation.
Design Decision 02: AI Depends on Data
The agent setup needed to make data readiness visible before activation.
I used the requirements panel to show what each agent needed, what was already connected, and what was still missing. This helped users understand the setup effort upfront and gave more context for trusting the output later.
Setting Up an Agent
Activation needed to feel guided, not like one large configuration screen.
I structured setup into clear steps for data sources, analysis range, frequency, thresholds, and result sharing. This helped users make one decision at a time while keeping the full setup understandable.
Design Decision 03: Analysis, Not Authority
Because Finmetrx works with financial information, AI needed a clear boundary.
Agents could analyze data, surface patterns, generate dashboards, and recommend next steps, but the final decision stayed with the user.
I designed the flow so users could review the setup, inspect the output, and keep asking questions without giving the system control over financial actions.

Design Decision 04: Making AI Progress Visible
Agent activation needed more feedback than a loading state.
I designed the progress experience to show what the agent was doing: checking data, running analysis, and preparing the output.
This made the wait feel more understandable and helped build trust before users reached the final dashboard.
From Agent to Intelligence
The agent output needed to become part of the product, not just a one-time response.
Once an agent completes its analysis, users can move into a structured dashboard, review the results, and continue asking follow-up questions in the same context.
This helped turn AI from a separate interaction into a working layer inside the financial workflow.
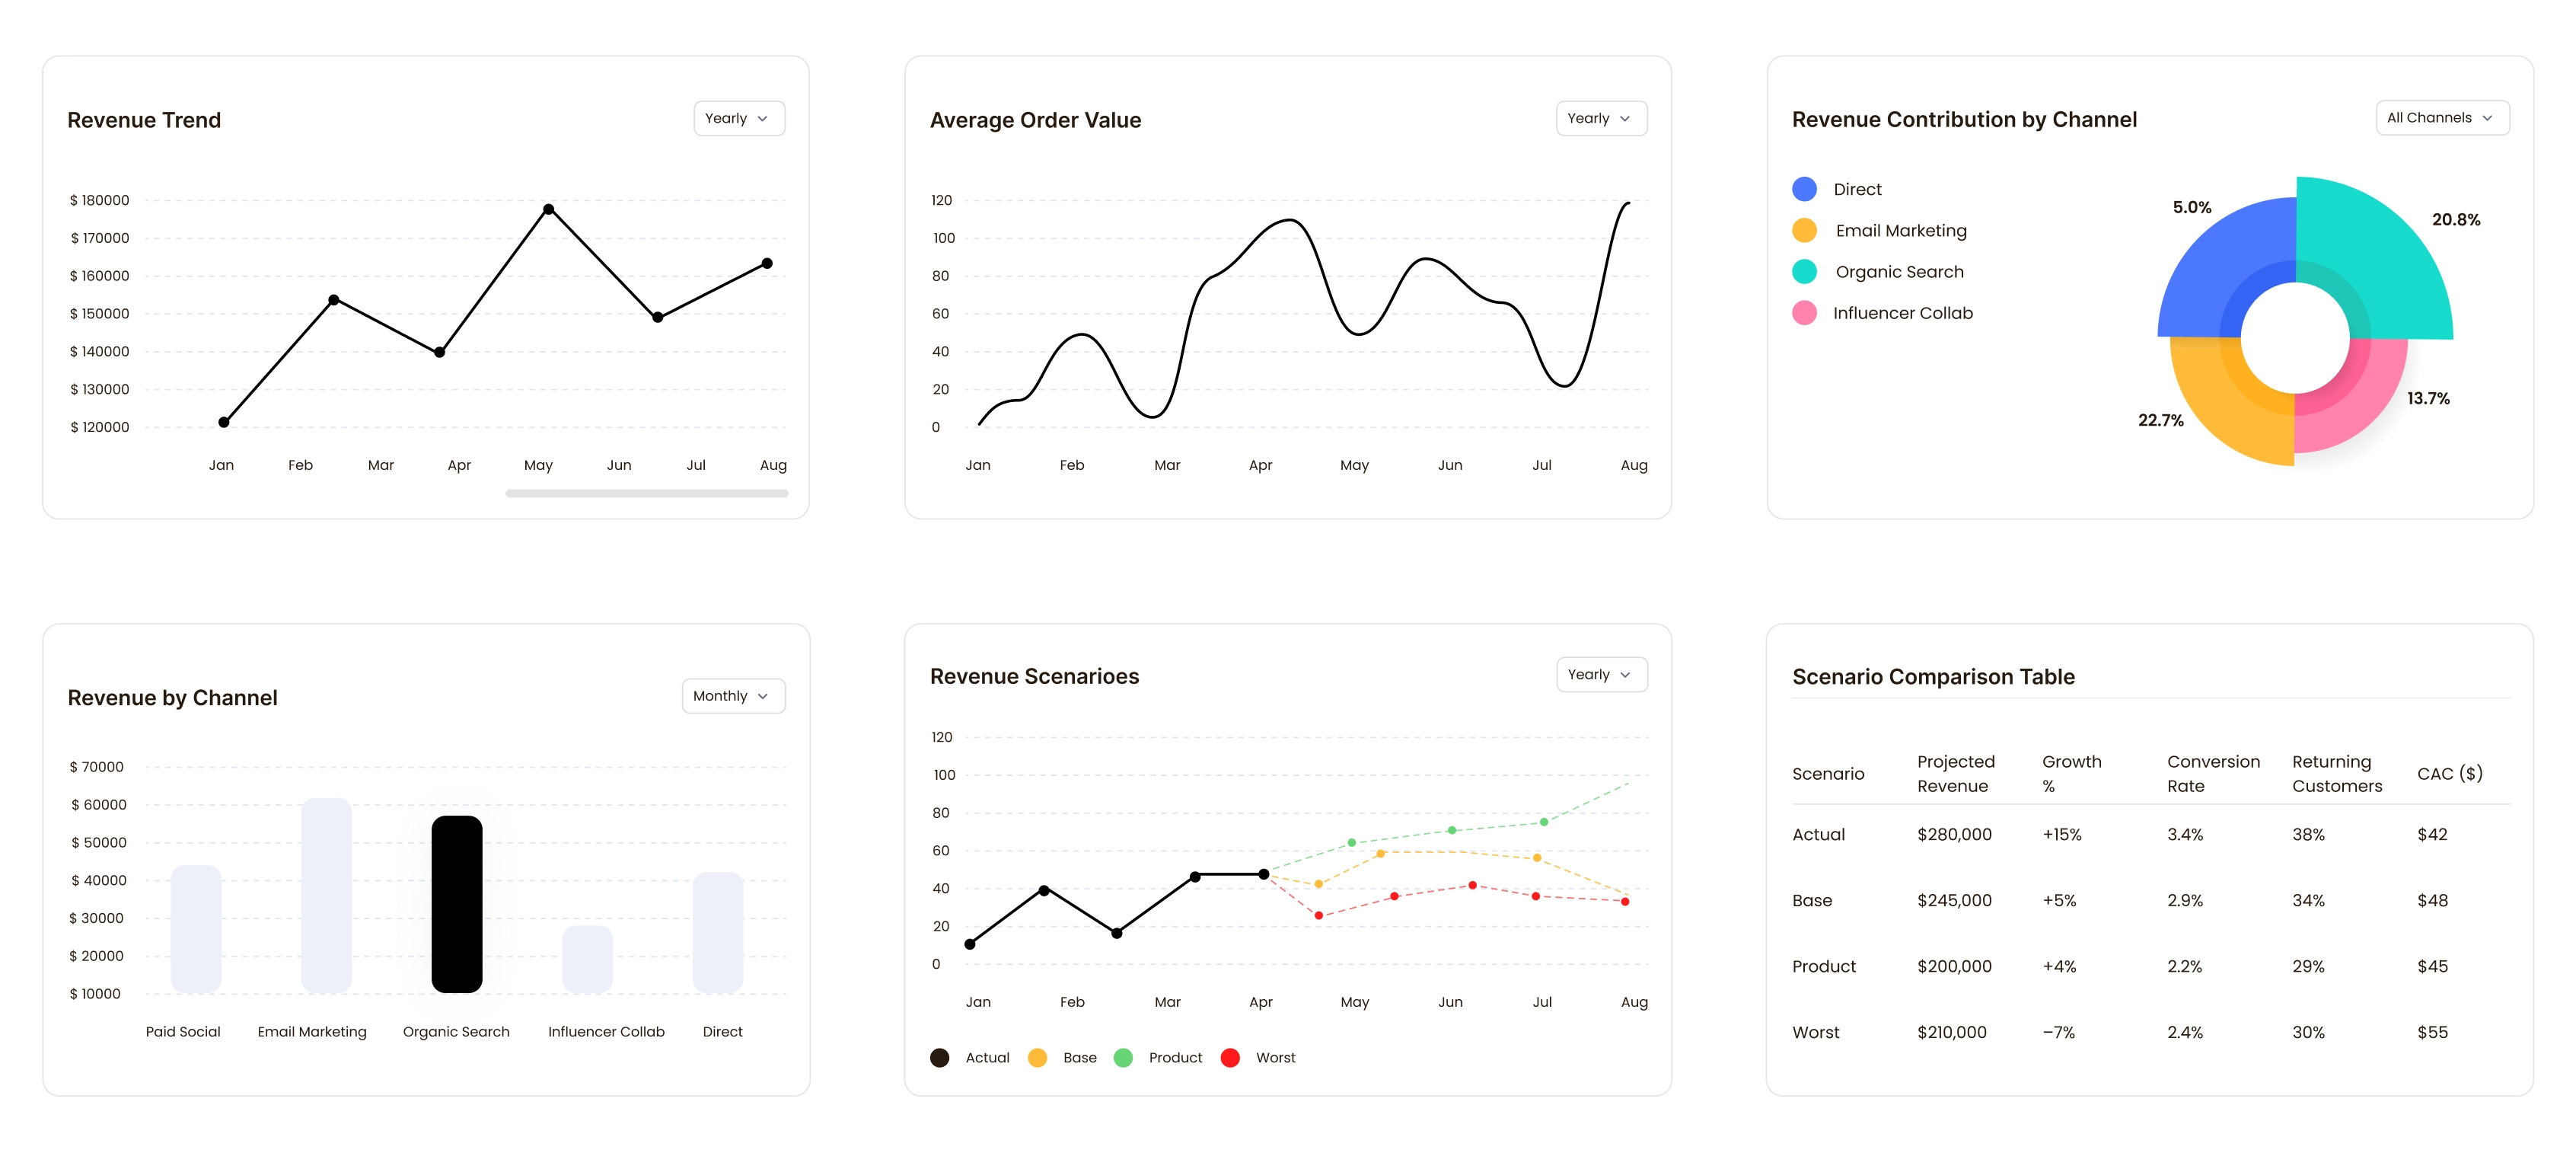
Visualizing the Analysis
The dashboard needed to make financial questions easier to read. I used different chart patterns for different jobs: trends for movement, comparisons for performance gaps, contribution views for what was driving the result, and tables where users needed exact numbers.
The goal was to make the analysis easier to scan without removing the detail users needed to trust it.
Publishing the Output
Once an agent generated a dashboard, the output needed to live inside the main workspace.
I designed the flow so users could save, revisit, and use agent-generated dashboards alongside their regular financial views.
This kept the agent’s work connected to the product instead of leaving it inside the setup flow.
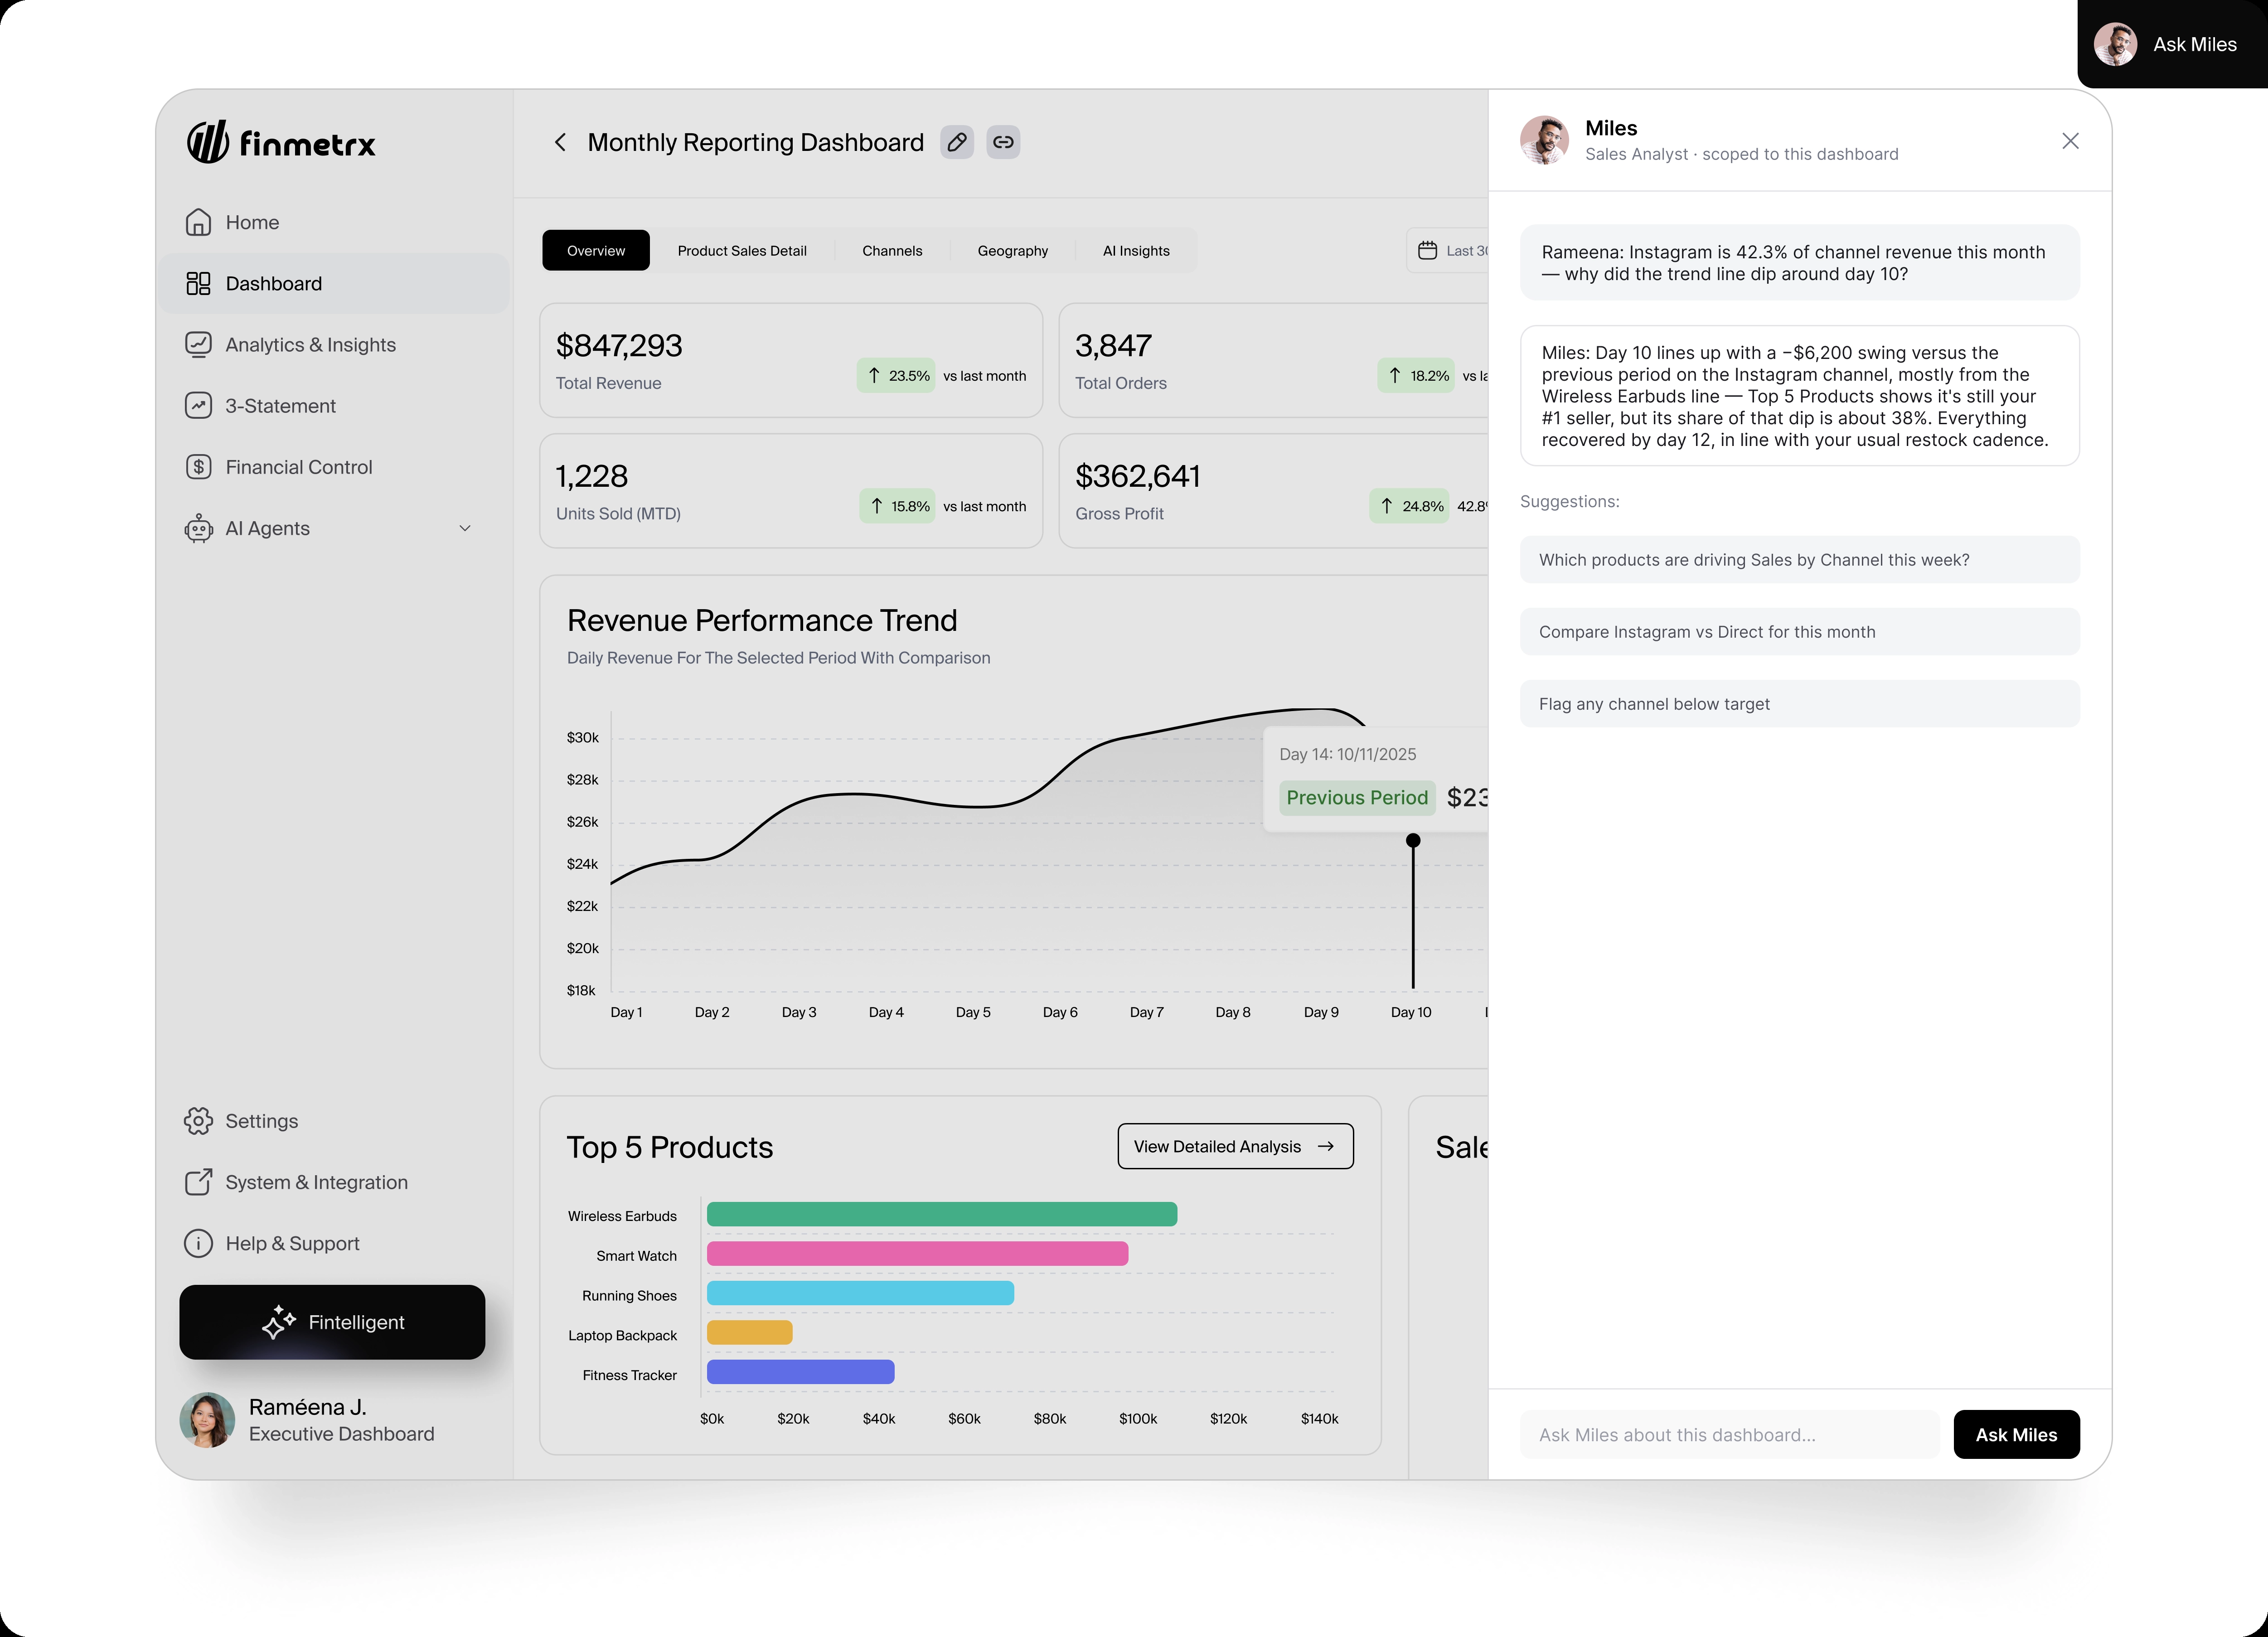
Working With The Specialist
After the dashboard was generated, users could keep working with the same specialist.
The specialist stayed scoped to that dashboard, so follow-up questions were tied to the numbers, charts, and context already on the screen.
This gave users a more focused way to investigate changes without leaving the financial workflow.
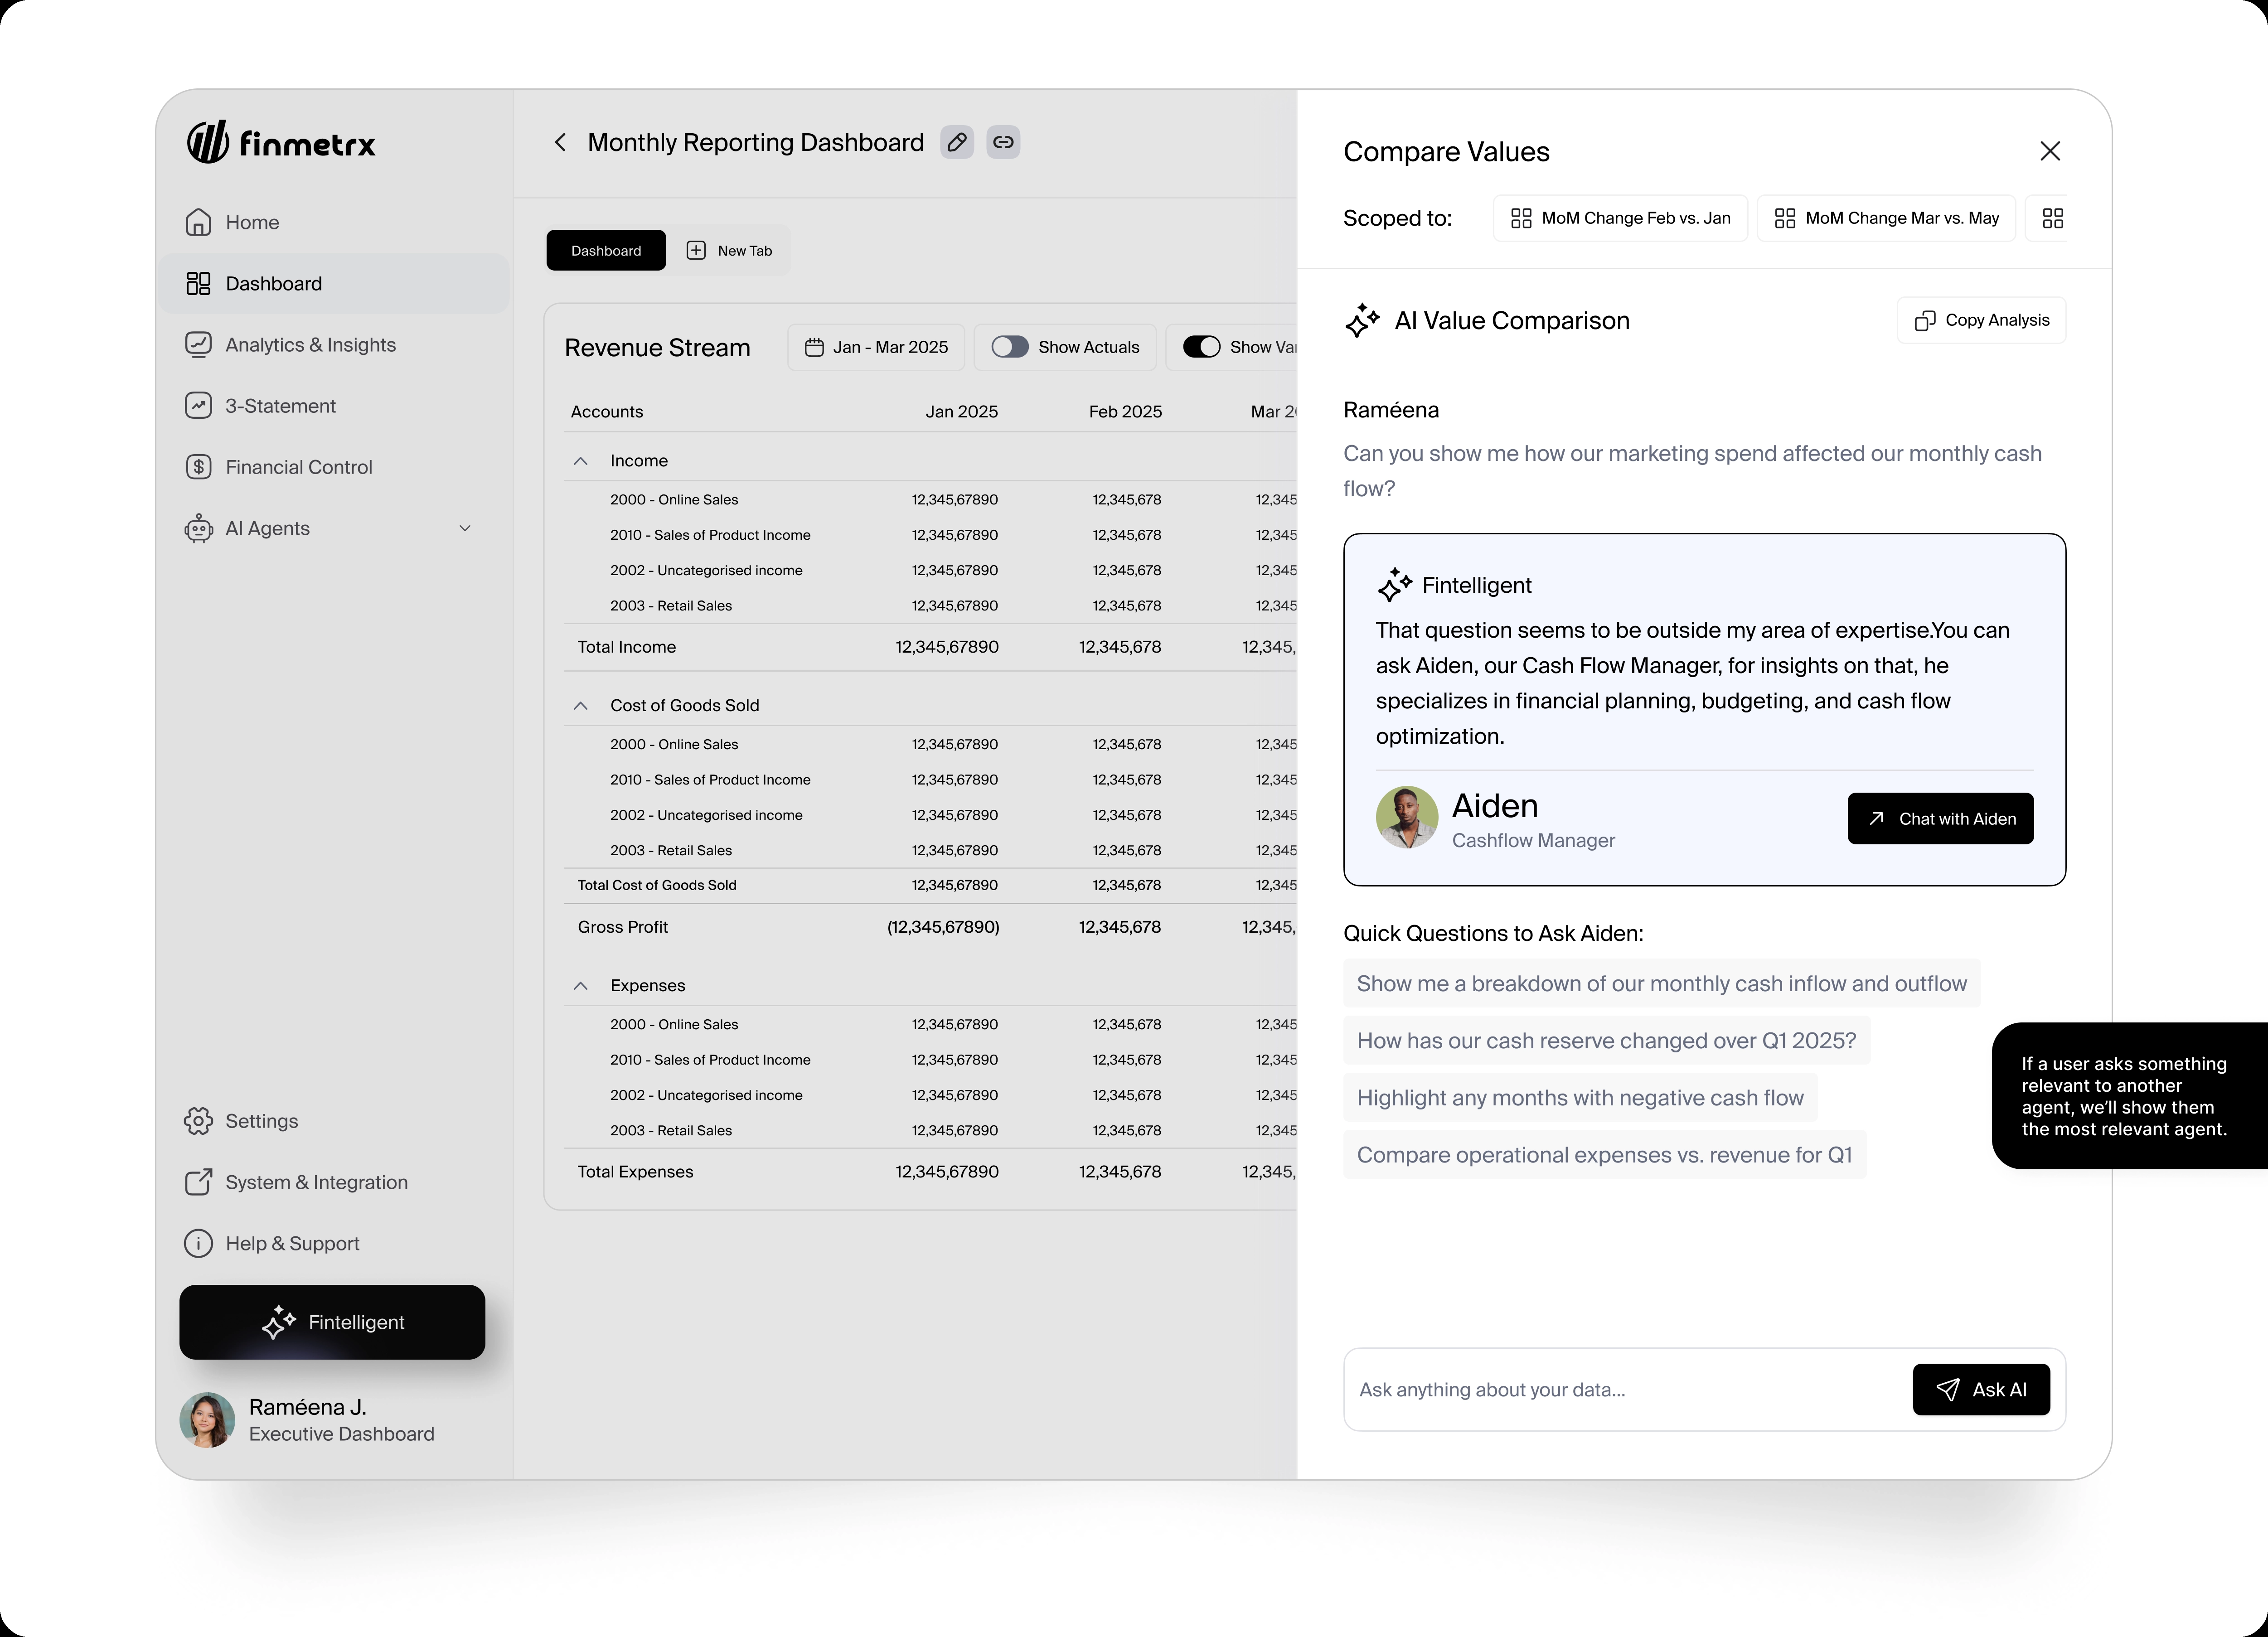
Fintelligent
Some questions do not start from one specific workflow. Fintelligent gives users a broader conversational layer across Finmetrx, so they can ask questions without knowing which dashboard or agent to begin with.
If a question belongs to a specialist, the system can guide the user to the right agent instead of forcing them to figure it out themselves.
Specialists provide depth. Fintelligent provides reach.
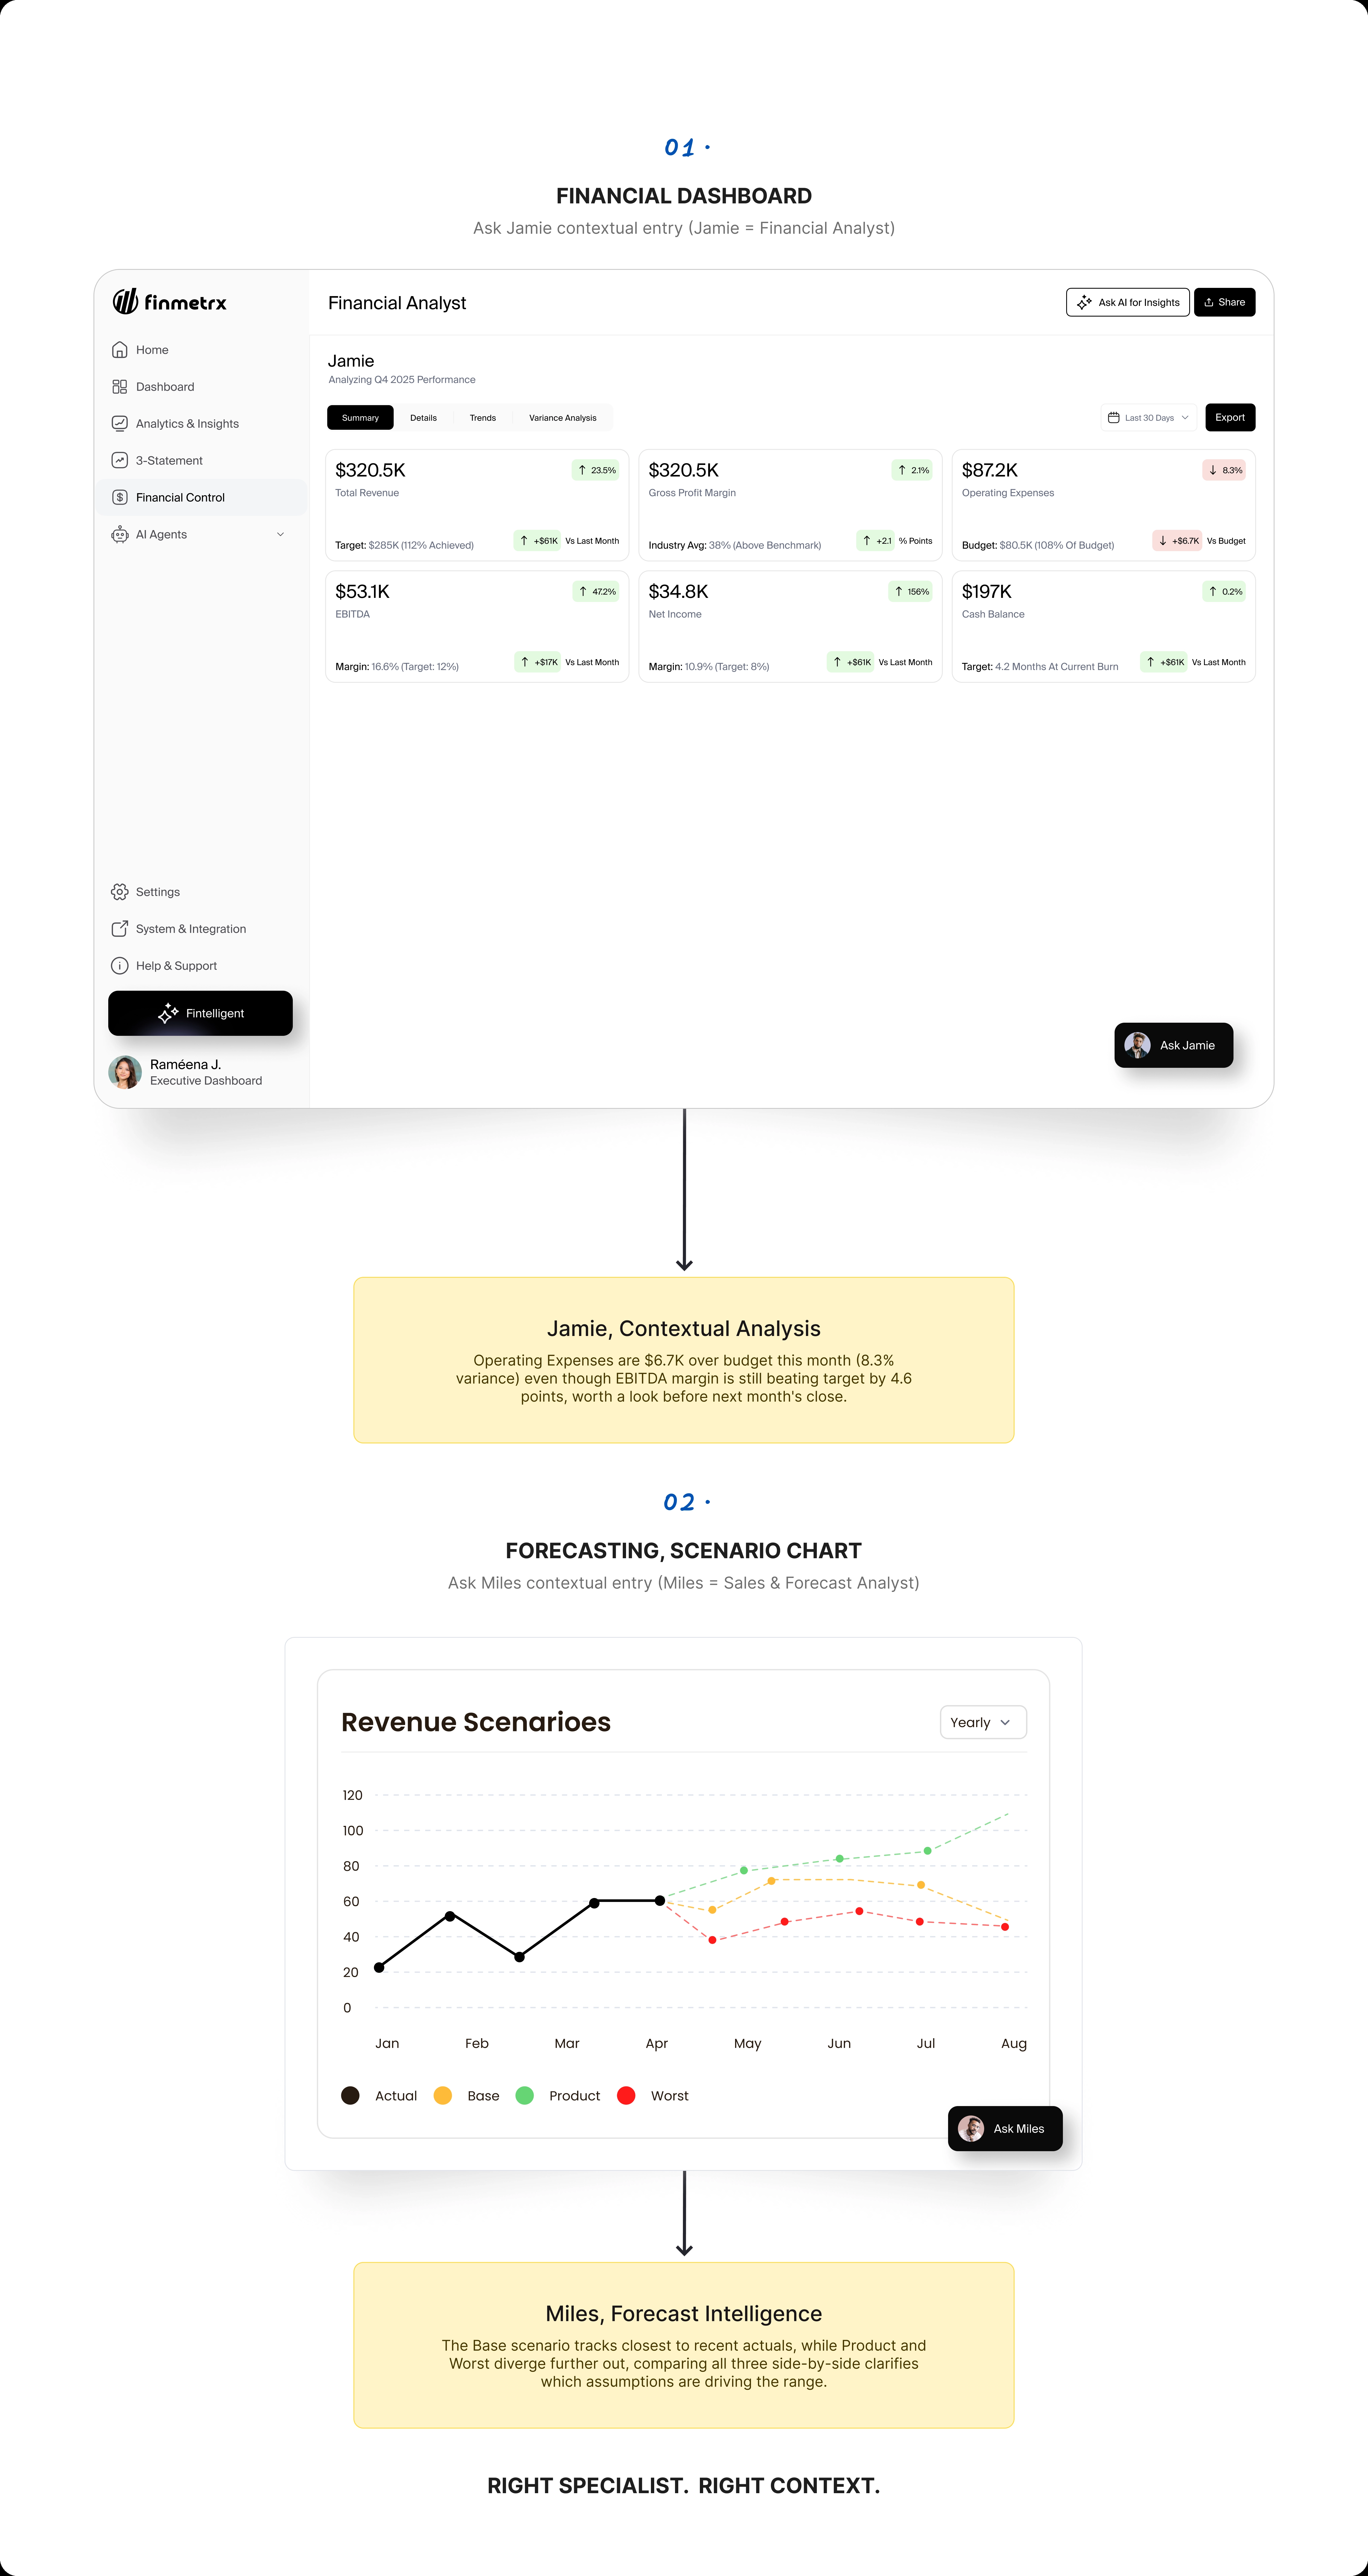
AI Where The Work Already Happens
I added contextual AI entry points inside the screens where users were already working.
A financial dashboard could connect users to Jamie, the financial analyst. A cashflow screen could connect them to the cashflow specialist. The entry point changed based on the workflow and the type of question.
This kept AI tied to the user’s current context instead of making them start again from a separate assistant screen.
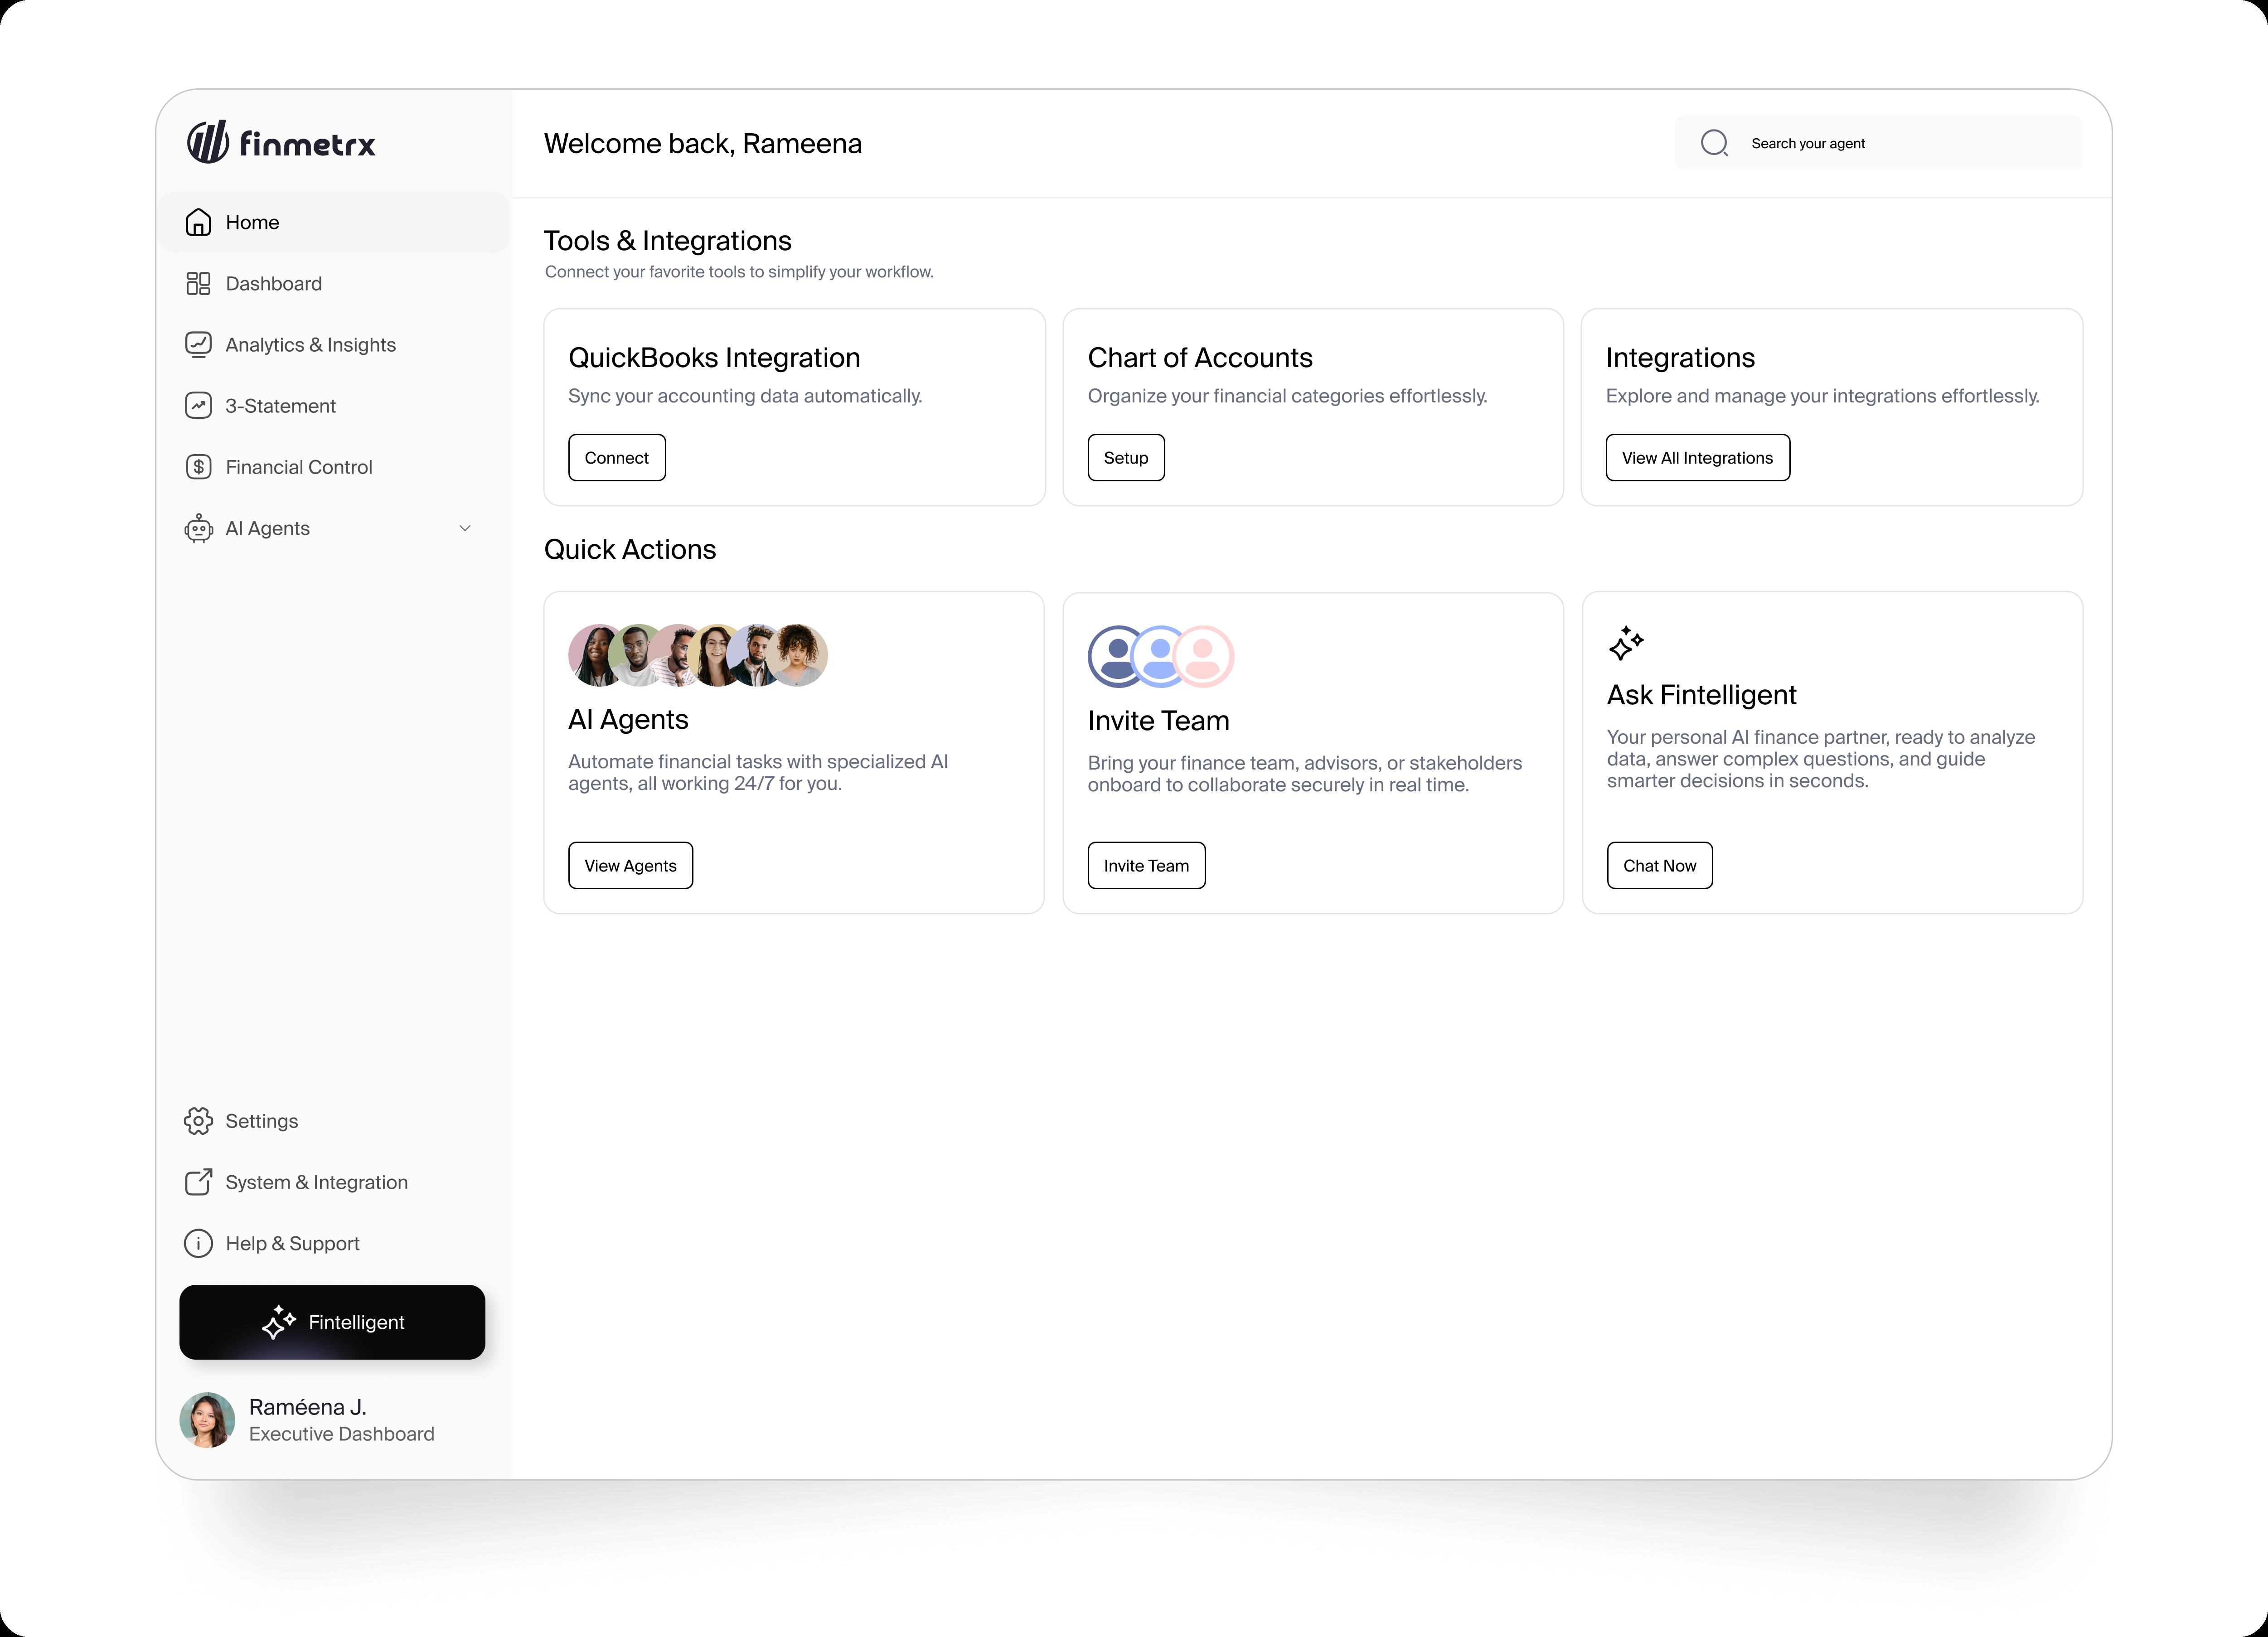
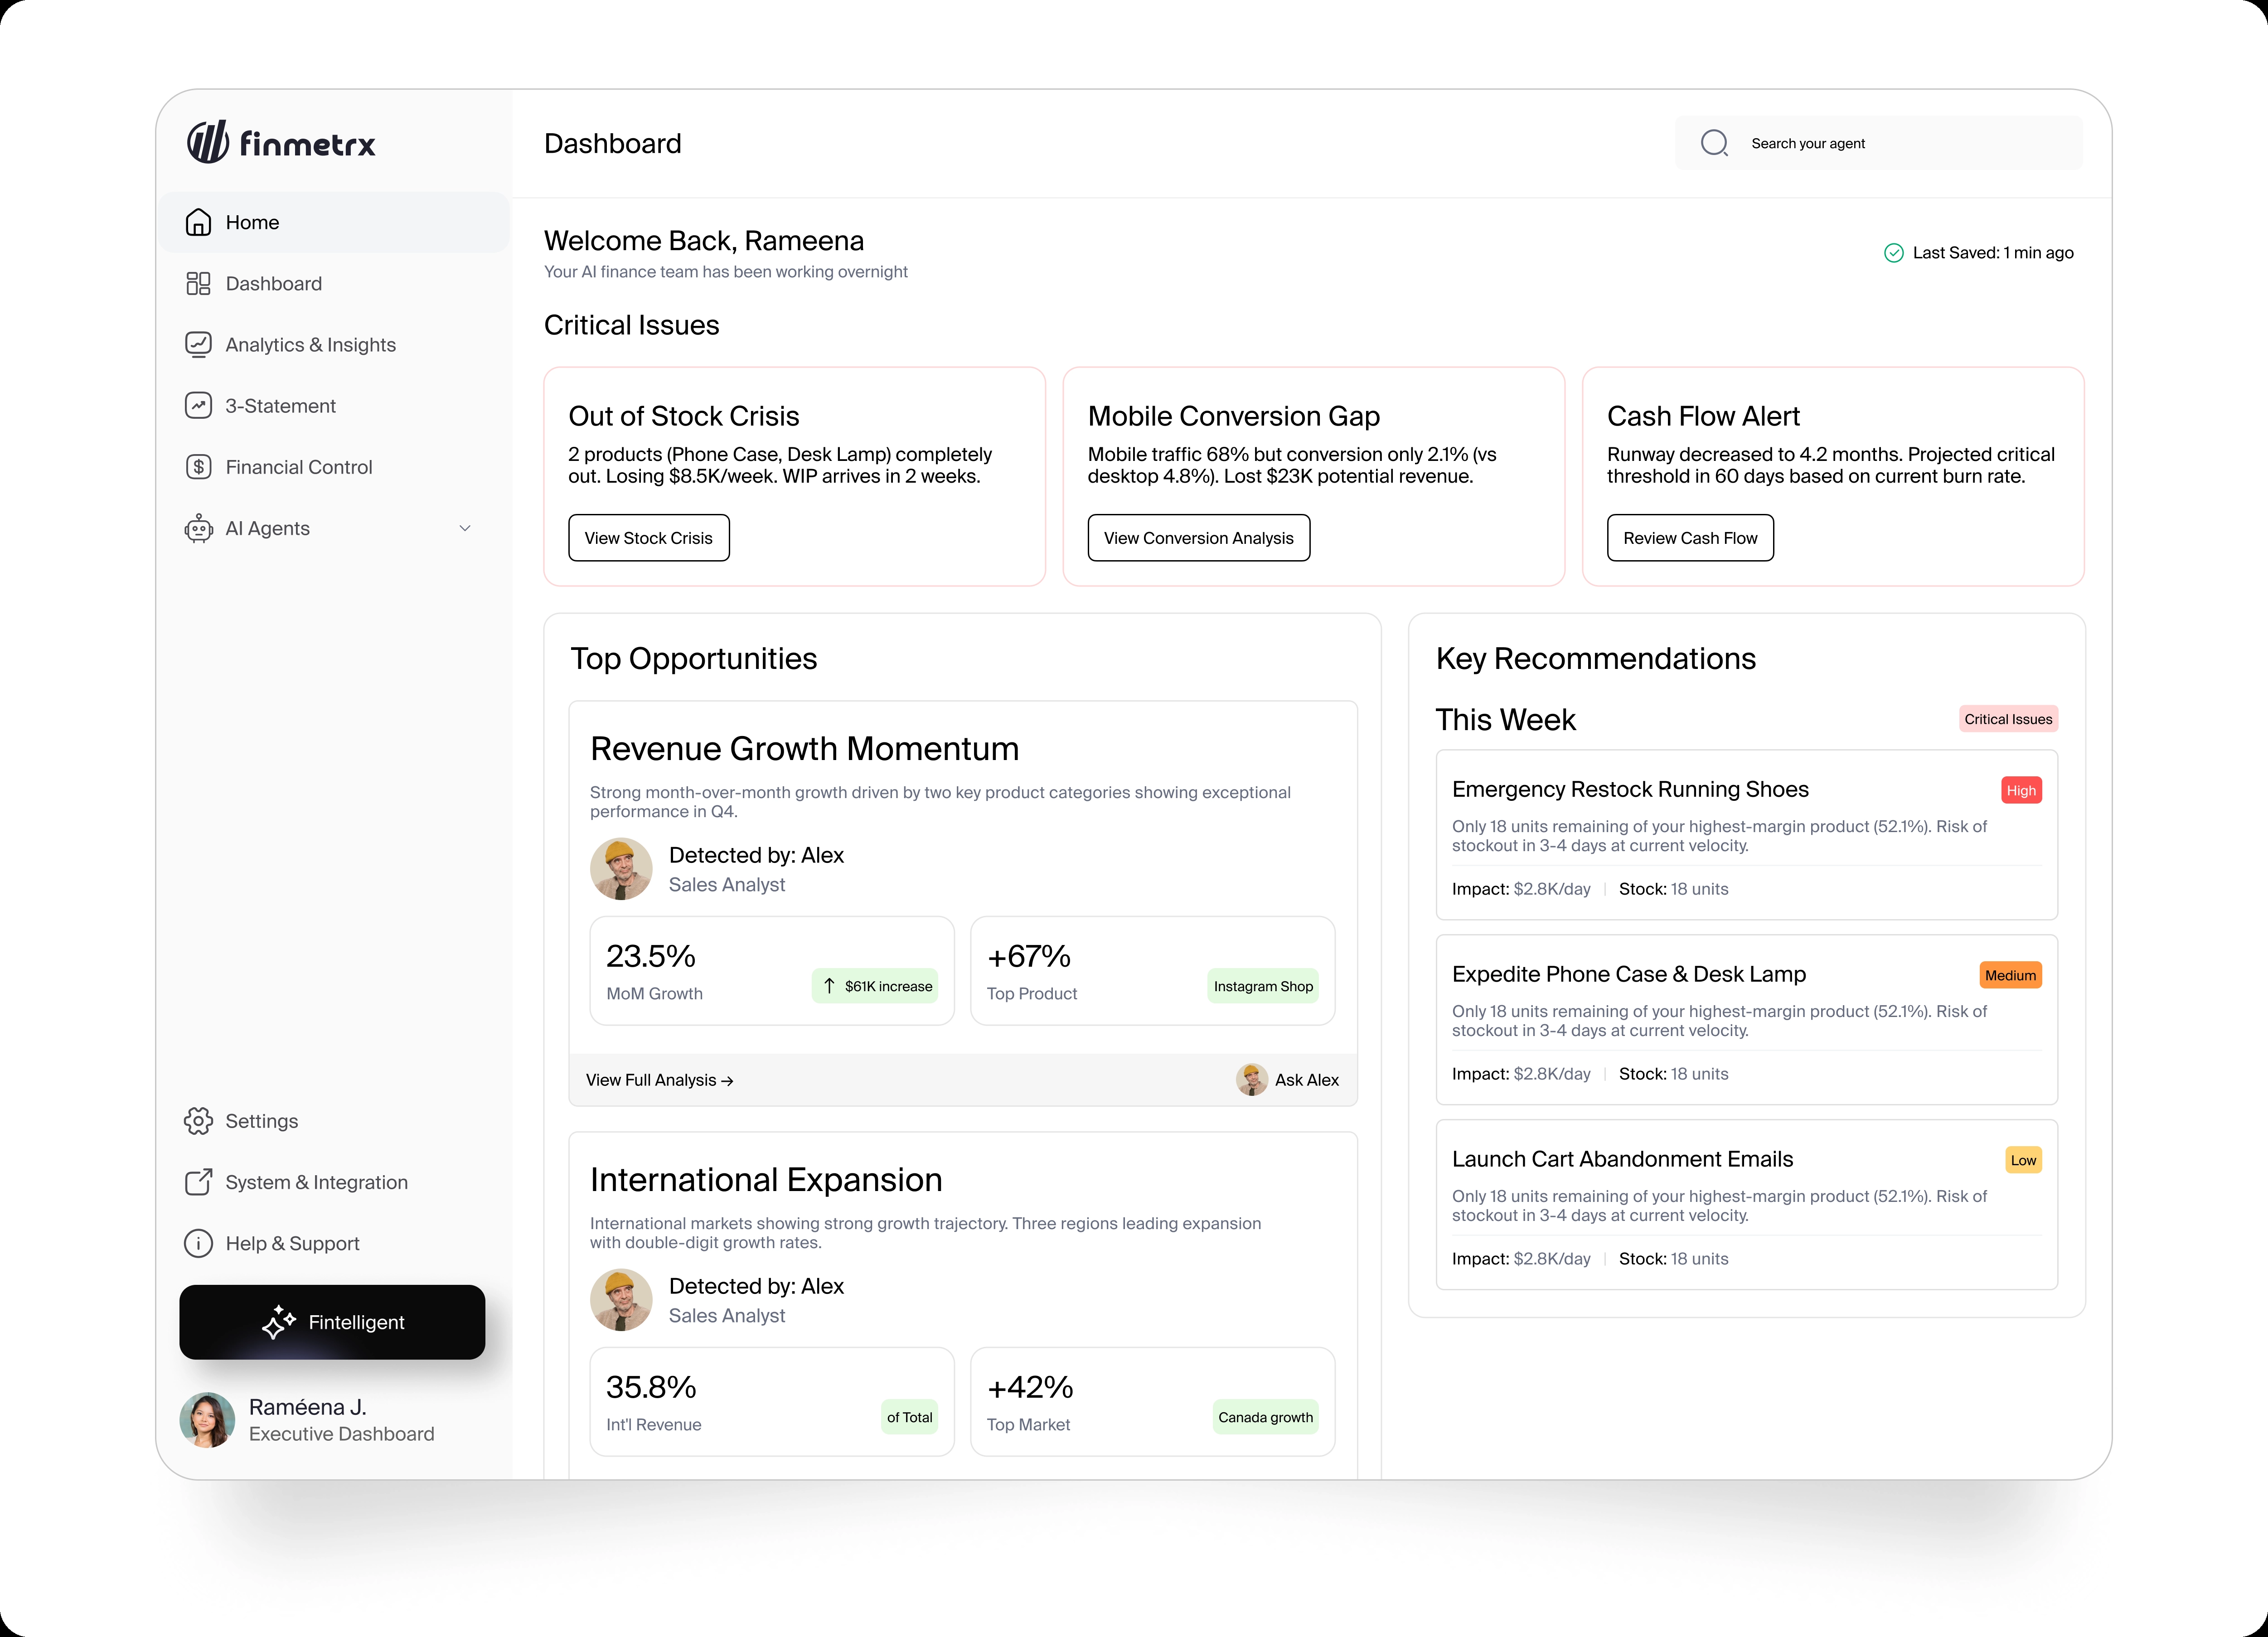
The Home Experience
The home screen needed to change based on how much data was already connected.
Before setup, it helped users access integrations, dashboards, AI agents, and core product areas.
Once data was available, the same space could surface issues, recommendations, and updates from the user’s AI finance team.
The goal was to shift the home screen from navigation to a clearer view of what needed attention.
Financial Dashboard
The financial dashboard needed to make performance easier to scan without hiding the detail.
I structured the view around the main performance summary first, then deeper layers like trends, variance, product details, channels, geography, and AI insights.
Metric cards were designed to show more than a number. Targets, comparisons, movement, and status indicators helped users understand whether the number needed attention.
Cashflow Manager
Cashflow needed more than a balance view. I structured the experience around the current cash position, cashflow statement, working capital, liquidity, and risk.
The goal was to help users see where pressure was building and what needed attention before it became harder to manage.
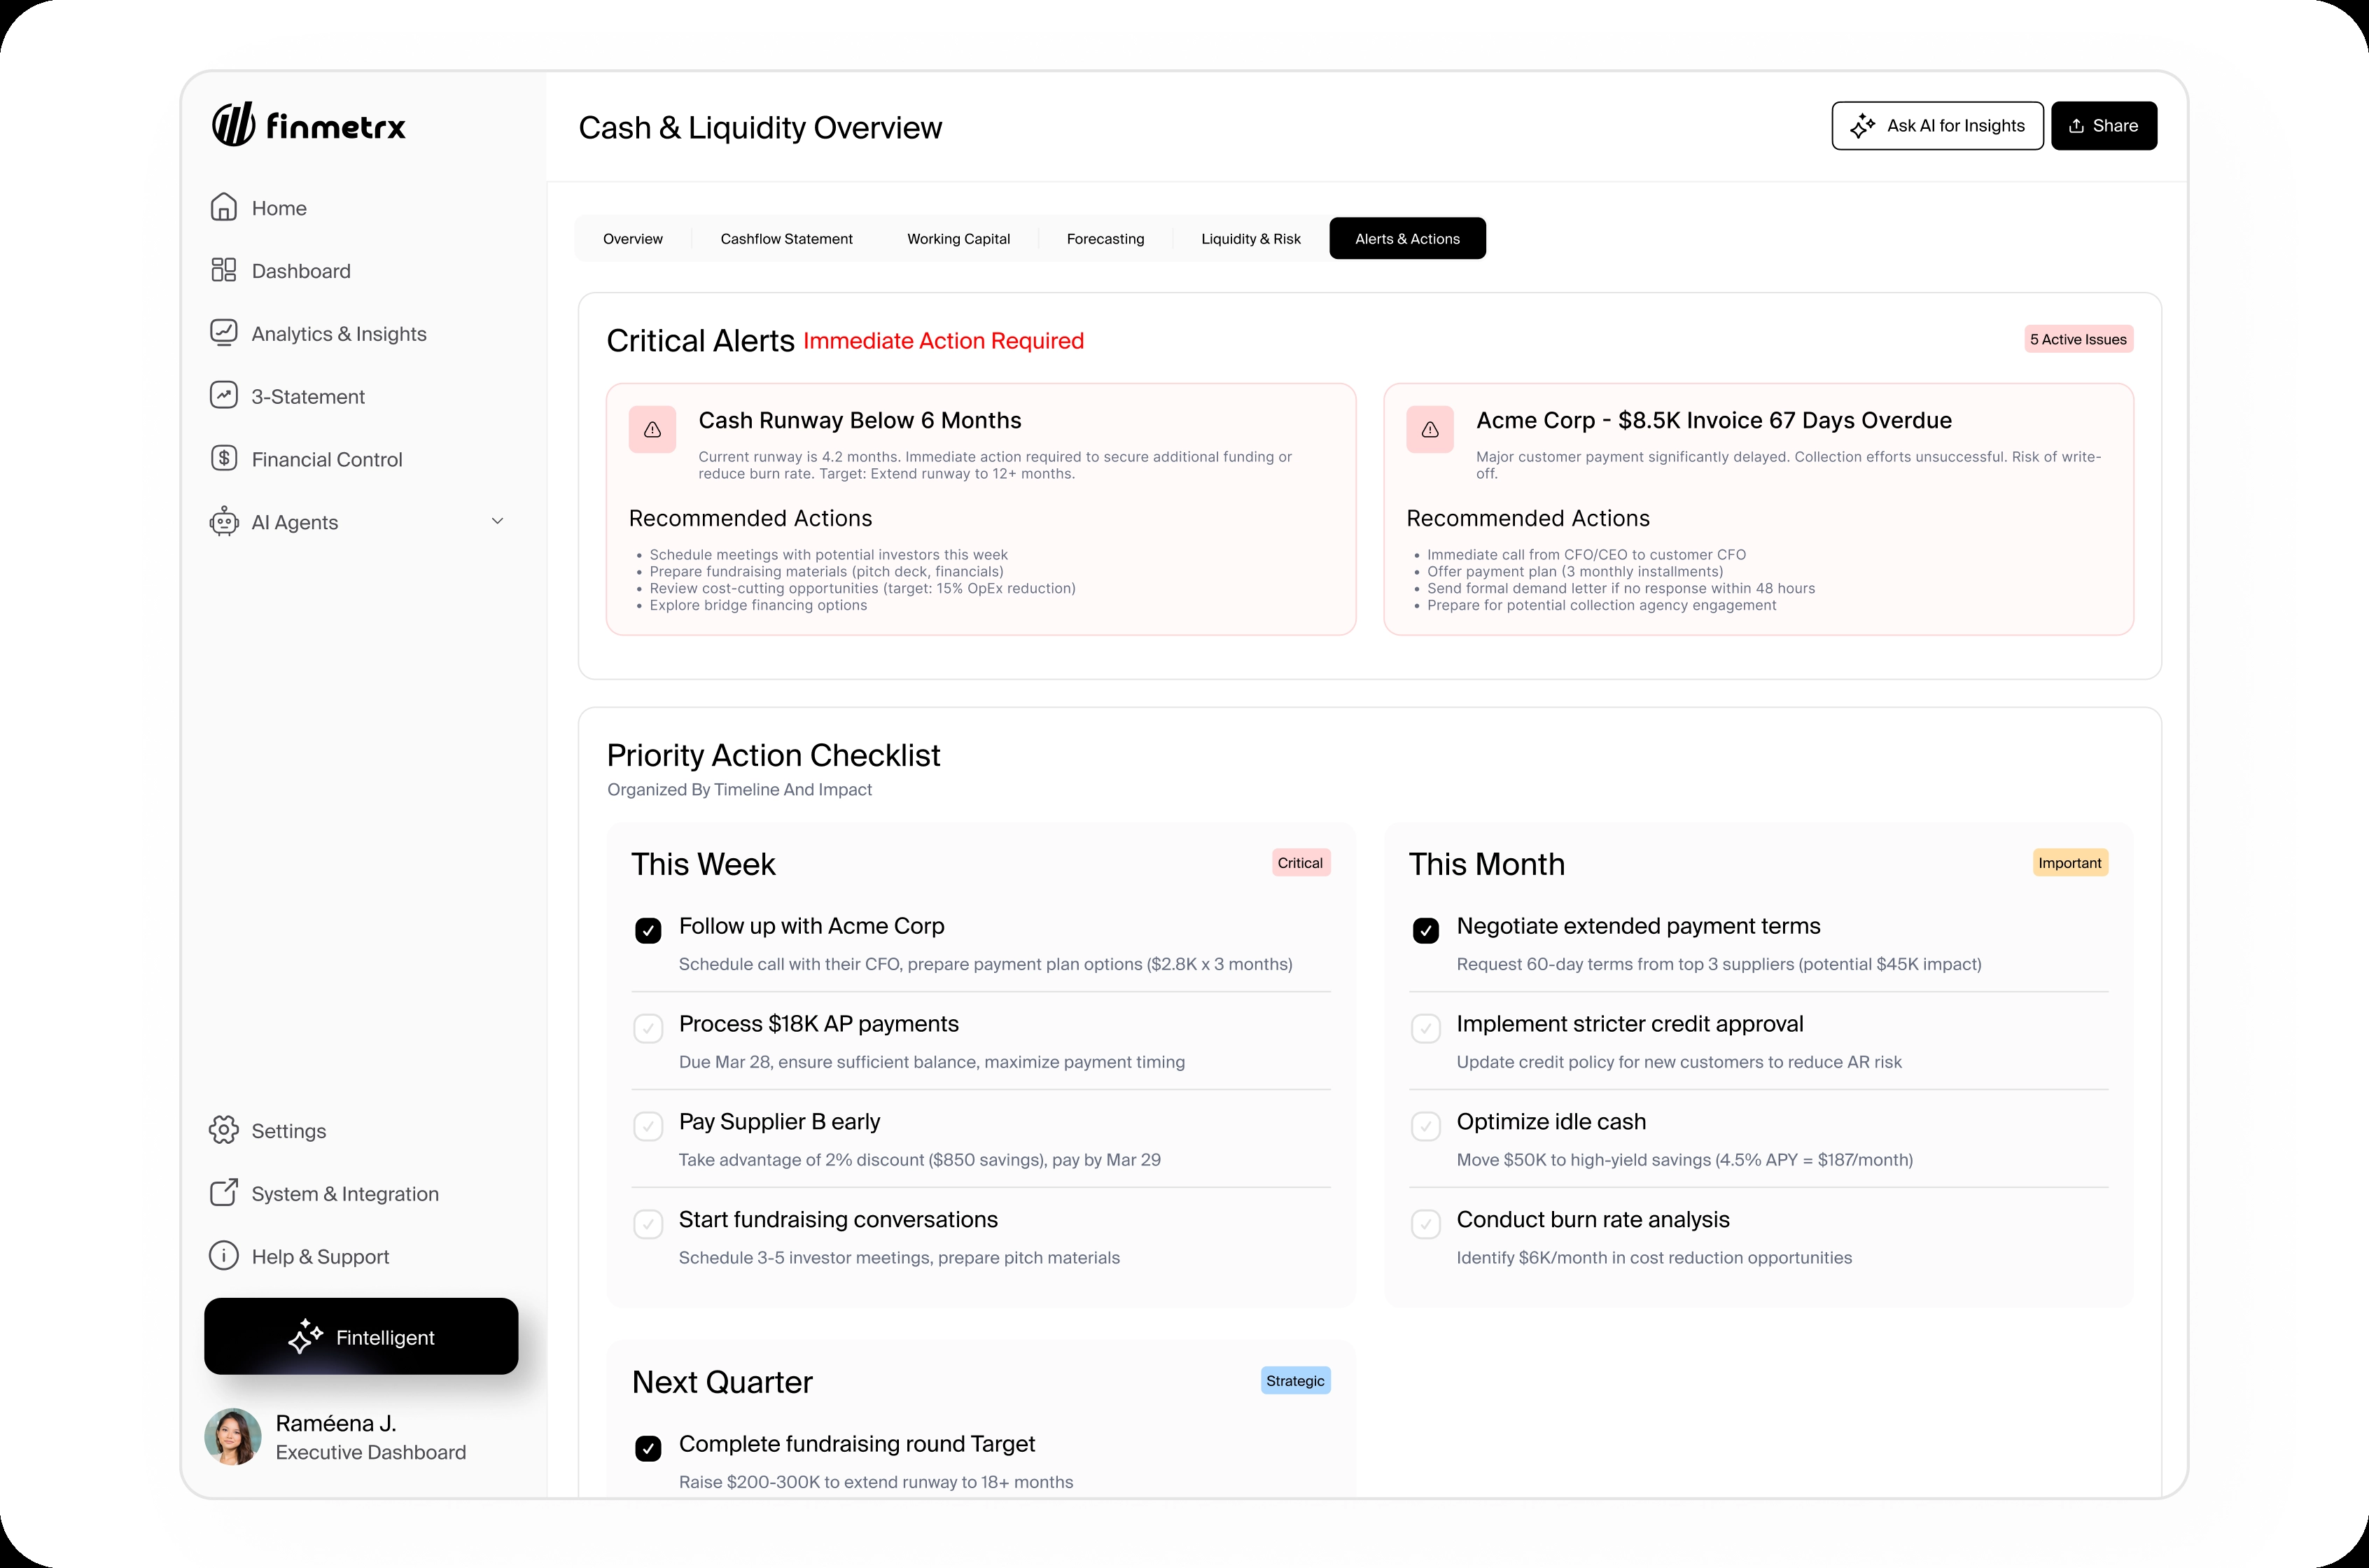
Design Decision 05: Turning Risk Into Action
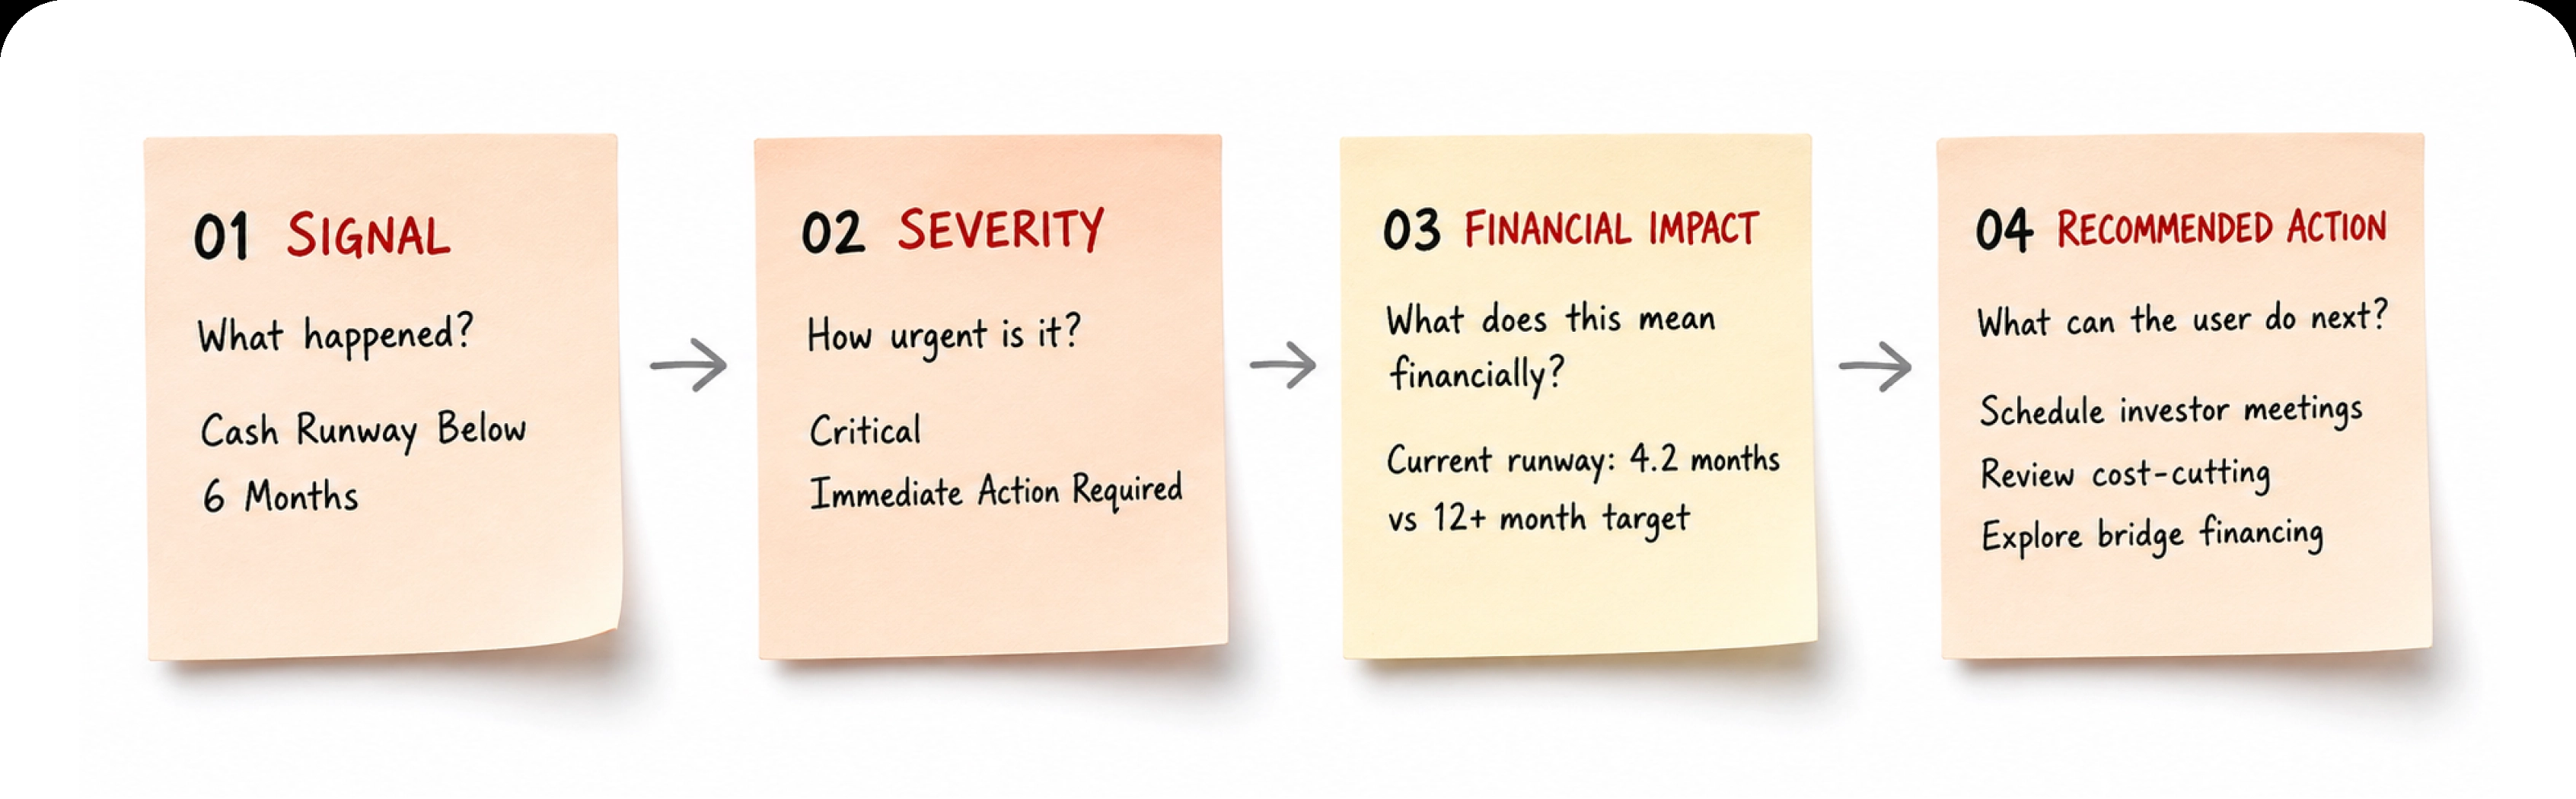
Cashflow alerts needed to explain more than what was wrong.
I structured each alert around the signal, severity, financial impact, and recommended action. That helped users understand how urgent the issue was, what it meant for the business, and what they could do next.
Turning Risk into Action
Beyond The Hero Screens
I also designed the supporting workflows that make the product feel complete. That included authentication, settings, profile management, connection states, navigation, empty states, and other utility flows.
These screens were treated as part of the same product language, because users notice the gaps when these details are missing or unclear.
Designing The System Behind It
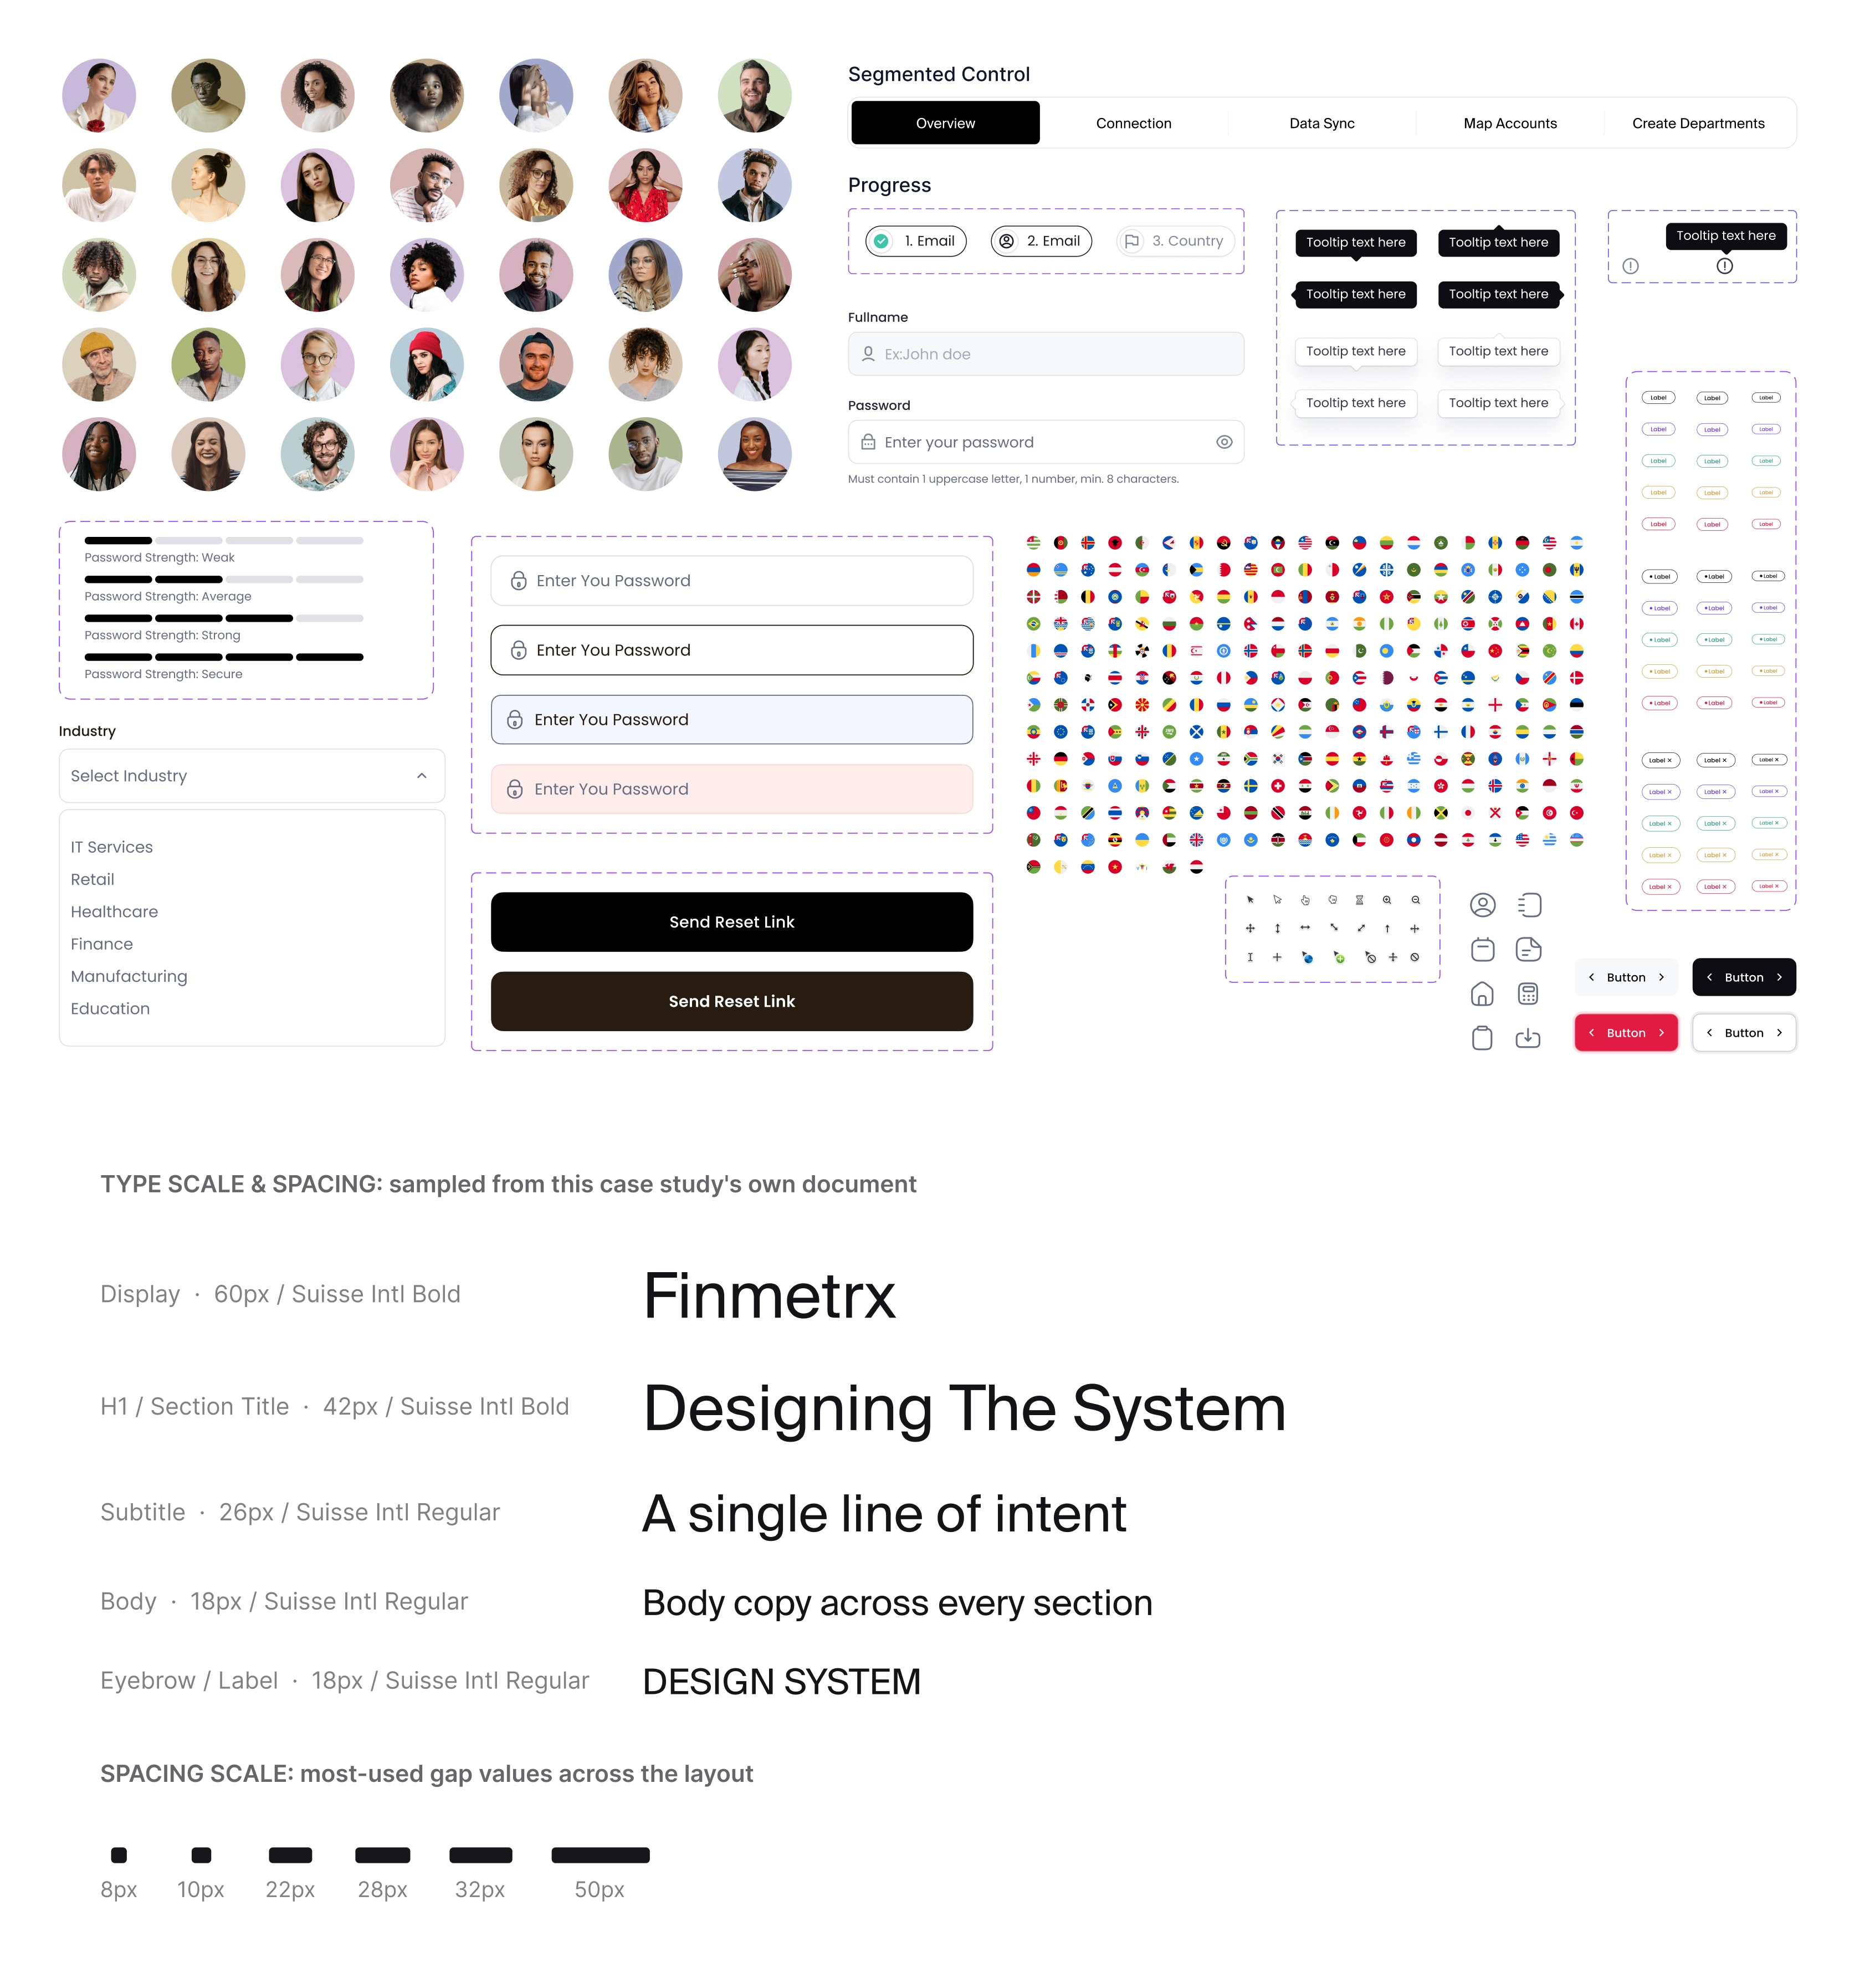
Finmetrx needed a design system that could support different types of work: dense financial tables, guided AI setup, dashboards, alerts, and conversation.
I defined reusable patterns for typography, spacing, controls, navigation, states, and components so the product could stay consistent as new workflows were added.
The system had to support detail where users needed accuracy, guidance where setup became complex, and flexibility for AI-generated outputs.
One Connected Experience
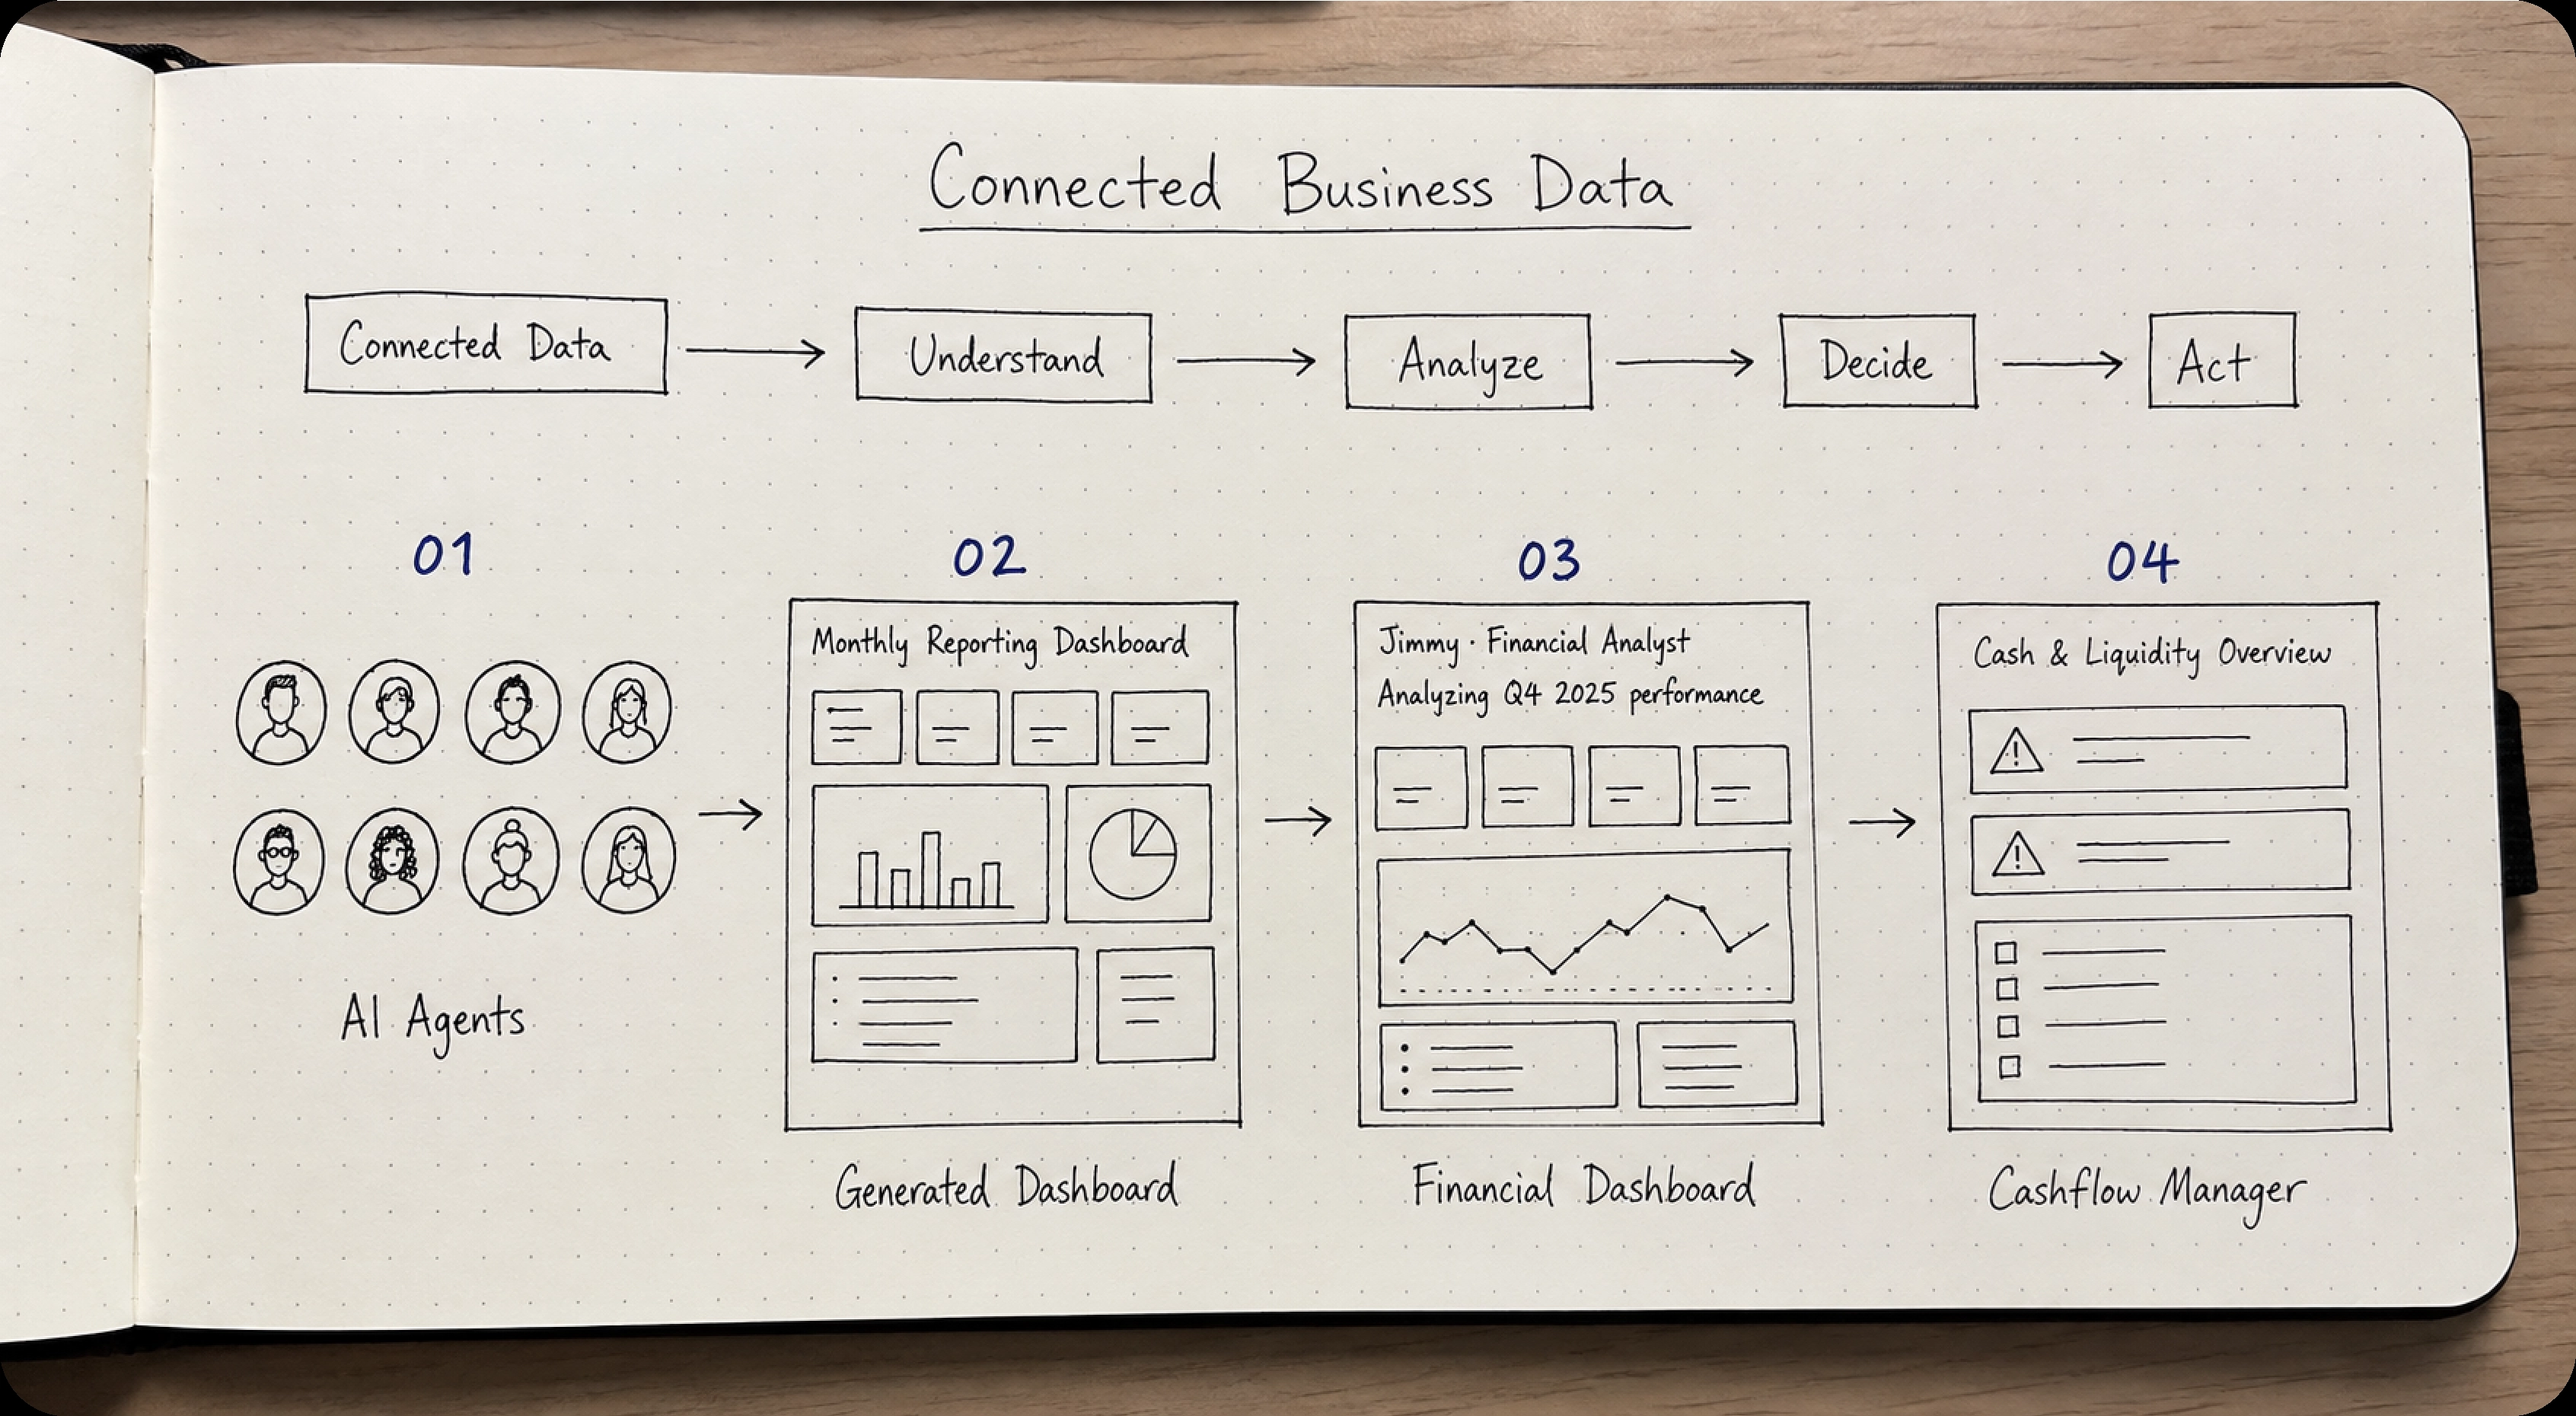
By the end, the work came together as one connected product experience. Users could move from connected data to dashboards, from dashboards into AI-generated analysis, and from analysis into follow-up questions or next steps.
The value was in how the pieces worked together: financial workflows, AI agents, conversation, and the design system behind them.
Outcome
The work helped move Finmetrx from complex financial and AI capabilities into a more structured product system. The agent experience became clearer across discovery, data requirements, setup, generated dashboards, and follow-up conversation.
Core financial workflows also became easier to scan, with dashboards, cashflow, and risk views structured around hierarchy, context, and next steps. The result was a product experience where users could move from financial data to analysis and action with less friction.
Reflection
Finmetrx changed how I think about AI inside complex products. The difficult part is deciding what the system needs to know, making those dependencies visible, and giving users control before automation begins.